黑马程序员---四天快速入门Python数据挖掘(第一天)
文章目录
- 一、数据挖掘基础环境安装与使用
-
- 1.1 库的安装
- 1.2 jupyter notebook使用
- 二、Matplotlib
-
- 2.1 Matplotlib之HelloWorld
-
- 2.1.1 什么是Matplotlib
- 2.1.2 为什么要学习Matplotlib
- 2.1.3 实现一个简单的Matplotlib画图
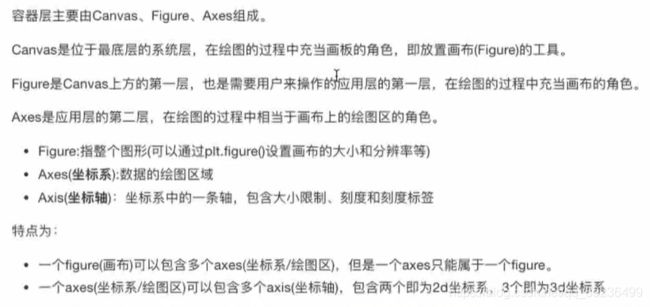
- 2.1.5 扩展知识点:Matplotlib三层结构
- 2.2 折线图(plot)与基础绘图功能
-
- 2.2.1 折线图绘制与保存图片
- 2.2.2 完善原始折线图1(辅助显示层)
- 2.2.3 完善原始折线图2(图像层)
- 2.2.4 多个坐标系显示:plt.subplots(面向对象的画图方法)
- 2.2.5 折线图的应用场景
- 2.3 散点图(scatter)
-
- 2.3.1 常见图像种类及意义
- 2.3.2 散点图绘制
- 2.4 柱状图(bar)
-
- 2.4.1 柱状图绘制
- 2.5 直方图(histogram)
-
- 2.5.1 直方图介绍
- 2.5.3 直方图绘制
- 2.6 饼图(pie)
-
- 2.6.1 饼图介绍
- 2.6.2 饼图绘制
链接:https://pan.baidu.com/s/1uu0V1n8bs4p6c242ym0tyA
可关注与博客同名公众号【zdb呀】,后台回复关键字提取码,免费获取B站黑马C++全套讲义的提取码
更多Python学习资料和你想要的Python电子书籍也可获取。
一、数据挖掘基础环境安装与使用
1.1 库的安装
本教程基于win10下,Python版本为3.7
- 创建虚拟环境
conda create -n data_mining python=3.7
- 激活环境
conda activate data_mining
- 安装需要的相关库
整个数据挖掘基础阶段会用到的库,为了统一版本号,安装以下版本
matplotlib==2.2.2
numpy==1.14.2
pandas==0.20.3
TA-Lib==0.4.16   # 技术指标库
tables==3.4.2    # hdf5
jupyter==1.0.0   # 数据分析与展示平台
使用以下命令
pip install matplotlib==2.2.2 -i https://pypi.douban.com/simple
pip install numpy -i https://pypi.douban.com/simple
pip install pandas -i https://pypi.douban.com/simple
pip install tables -i https://pypi.douban.com/simple
pip install jupyter==1.0.0 -i https://pypi.douban.com/simple
安装TA-Lib需要找轮子,安装教程查看此链接:博客链接
1.2 jupyter notebook使用
jupyter怎么使用查看我的另外一篇博客:链接
jupyter设置代码自动补全功能:教程链接
优势:
- 画图方便
- 数据展示方便:按代码块运行
1 界面启动:终端输入:
jupyter notebook
2 cell操作
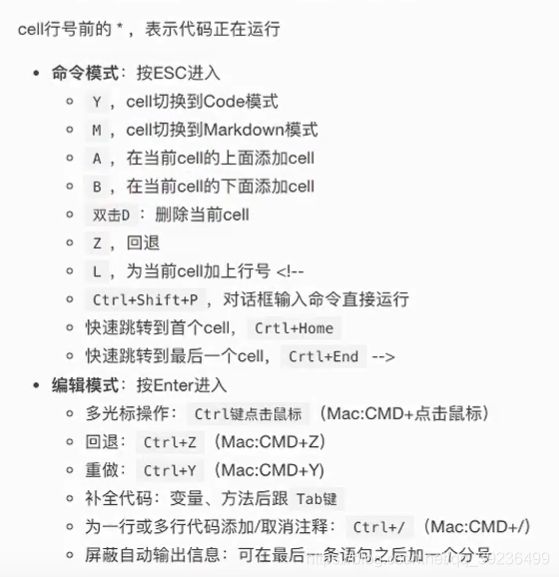
cell:一块代码块
编辑模式
命令模式:按ESC退出编辑,进入命令模式
2)快捷键操作
shift +enter:执行本单元格代码,并跳转到下一单元
Ctrl+enter:执行本单元代码,留在本单元
二、Matplotlib
2.1 Matplotlib之HelloWorld
2.1.1 什么是Matplotlib
专门用于开发2D图表(包括3D图表),画二维图表的工具库
以渐进、交互式方式实现数据可视化
mat:matrix矩阵
plot:画图
lib:library库
2.1.2 为什么要学习Matplotlib
可视化是在整个数据挖掘的关键辅助工具,可以清晰的理解数据,从而调整我们的分析方法。
- 能将数据进行可视化,更直观的呈现
- 使数据更加客观、更具有说服力
2.1.3 实现一个简单的Matplotlib画图
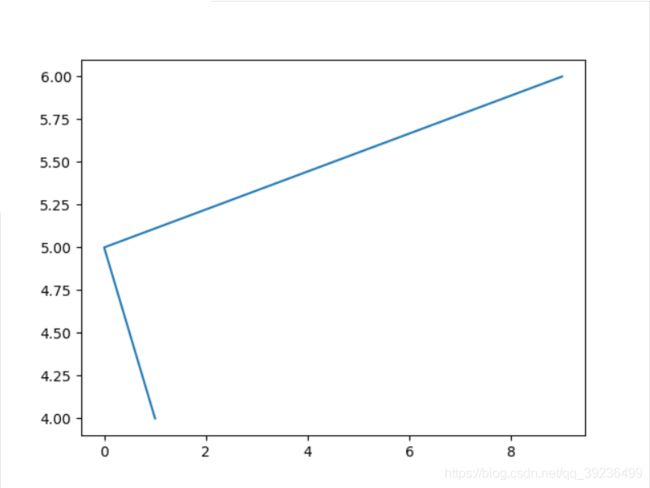
import matplotlib.pyplot as plt
#%matplotlib inline
plt.figure()
plt.plot([1,0,9],[4,5,6])  # x,y
plt.show()
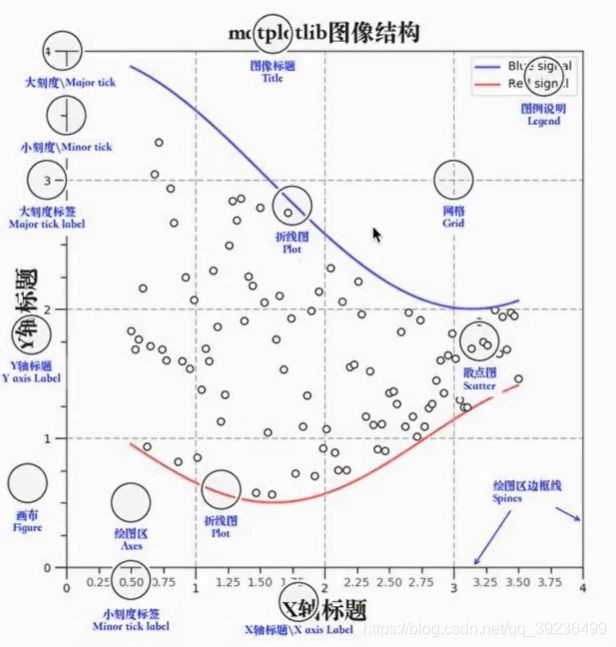
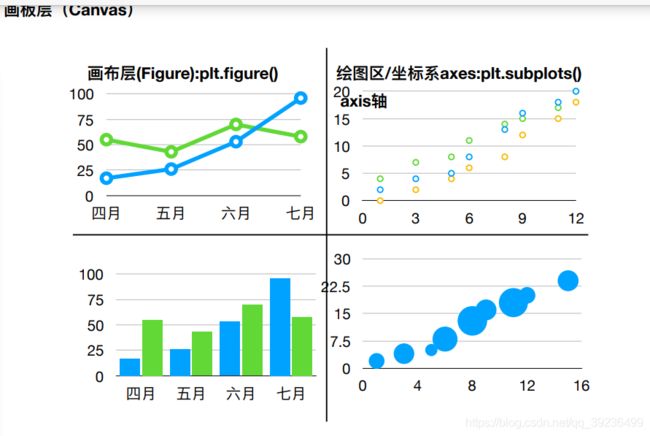
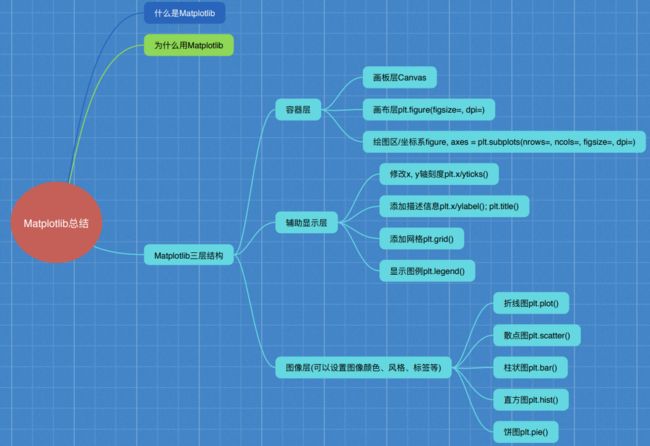
2.1.5 扩展知识点:Matplotlib三层结构
1 容器层
2 辅助显示层
3 图像层
2.2 折线图(plot)与基础绘图功能
2.2.1 折线图绘制与保存图片
为了更好地理解所有基础绘图功能,我们通过天气温度变化的绘图来融合所有的基础API使用
1 matplotlib.pyplot模块
该模块包含了一系列类似于MATLAB的画图函数。它的函数作用于当前图形(figure)的当前坐标系(axes)
import matplotlib.pyplot as plt
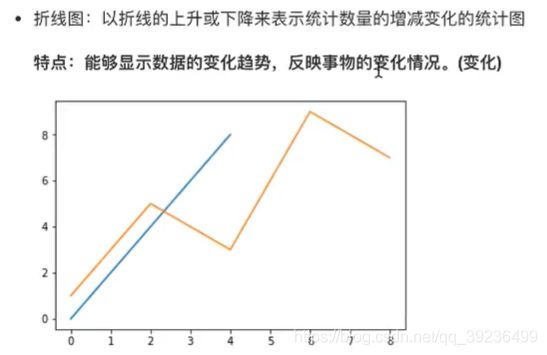
2 折线图绘制与显示
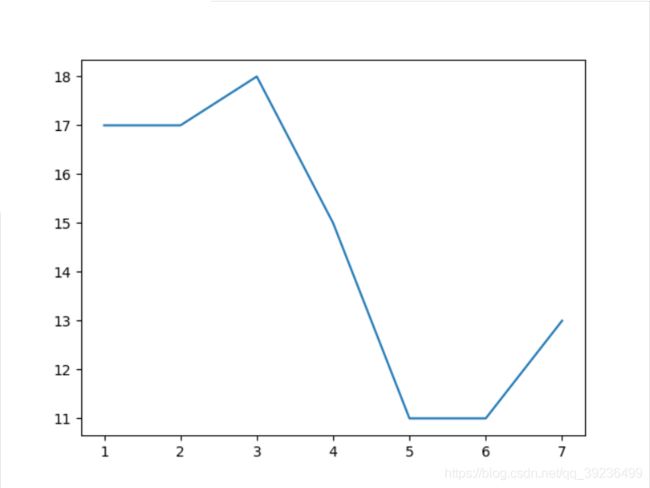
展现上海一周的天气,比如从星期一到星期日的天气温度
import matplotlib.pyplot as plt
# 折线图绘图与显示
# 1、创建画布
plt.figure()
# 2、
plt.plot([1,2,3,4,5,6,7],[17,17,18,15,11,11,13])
# 3、显示图像
plt.show()
3 设置画布属性与图片保存
plt.figure(figsize=(), dpi=)
	sigsize:指定图的长度
	dpi:图像的清晰度
	返回fig对象
plt.savefig(path)
例:
import matplotlib.pyplot as plt
# 折线图绘图与显示
# 1、创建画布
plt.figure(figsize=(20,8), dpi=80)
# 2、创建图像
plt.plot([1,2,3,4,5,6,7],[17,17,18,15,11,11,13])
# 保存图像
plt.savefig("test78.png")

# 3、显示图像
plt.show()
2.2.2 完善原始折线图1(辅助显示层)
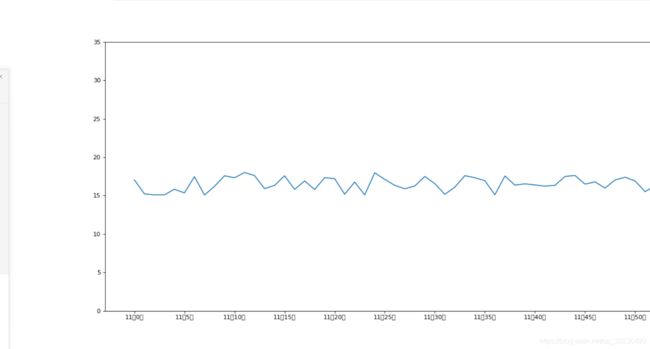
1 准备数据并画出初始折线图
import matplotlib.pyplot as plt
import random
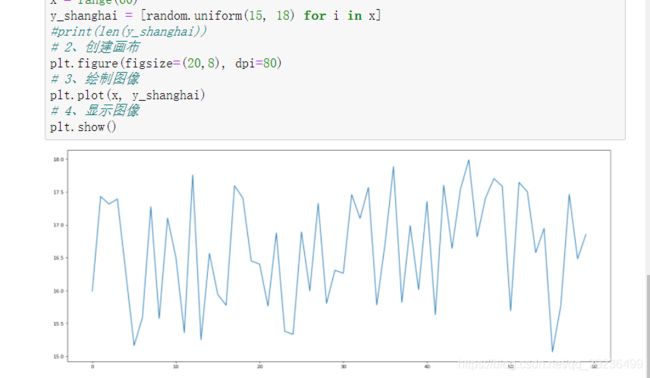
# 需求 :画出城市11点到12点1小时内每分钟的温度变化折线图,范围在15~18度
# 1、准备数据 x,y
x = range(60)
y_shanghai = [random.uniform(15, 18) for i in x]
#print(len(y_shanghai))
# 2、创建画布
plt.figure(figsize=(20,8), dpi=80)
# 3、绘制图像
plt.plot(x, y_shanghai)
# 4、显示图像
plt.show()
import matplotlib.pyplot as plt
import random
from matplotlib.font_manager import FontProperties  # 字体管理器
#font = FontProperties(fname="C:\\Windows\\Fonts\\simsunb.ttf", size=15)  # 设置汉字格式
# 需求 :画出城市11点到12点1小时内每分钟的温度变化折线图,范围在15~18度
# 1、准备数据 x,y
x = range(60)
y_shanghai = [random.uniform(15, 18) for i in x]
#print(len(y_shanghai))
# 2、创建画布
plt.figure(figsize=(20,8), dpi=80)
# 3、绘制图像
plt.plot(x, y_shanghai)
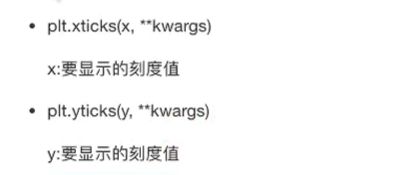
# 修改x,y刻度
# 准备x的刻度说明
x_label = ["11点{}分".format(i) for i in x]
plt.xticks(x[::5], x_label[::5])
plt.yticks(range(40)[::5])  # y刻度
# 4、显示图像
plt.show()
# 添加网格显示
plt.grid(True, linestyle='--', alpha=0.5)
5 添加描述信息
添加x轴,y轴描述信息及标题
import matplotlib.pyplot as plt
import random
from matplotlib.font_manager import FontProperties  # 字体管理器
#font = FontProperties(fname="C:\\Windows\\Fonts\\simsunb.ttf", size=15)  # 设置汉字格式
# 需求 :画出城市11点到12点1小时内每分钟的温度变化折线图,范围在15~18度
# 1、准备数据 x,y
x = range(60)
y_shanghai = [random.uniform(15, 18) for i in x]
#print(len(y_shanghai))
# 2、创建画布
plt.figure(figsize=(20,8), dpi=80)
# 3、绘制图像
plt.plot(x, y_shanghai)
# 修改x,y刻度
# 准备x的刻度说明
x_label = ["11点{}分".format(i) for i in x]
plt.xticks(x[::5], x_label[::5])
plt.yticks(range(40)[::5])  # y刻度
# 添加网格显示
plt.grid(True, linestyle='--', alpha=0.5)
# 添加标题
plt.xlabel("time")
plt.ylabel("temperature")
plt.title("figure_1")
# 4、显示图像
plt.show()
2.2.3 完善原始折线图2(图像层)
需求:再添加一个城市的温度变化
显示图例
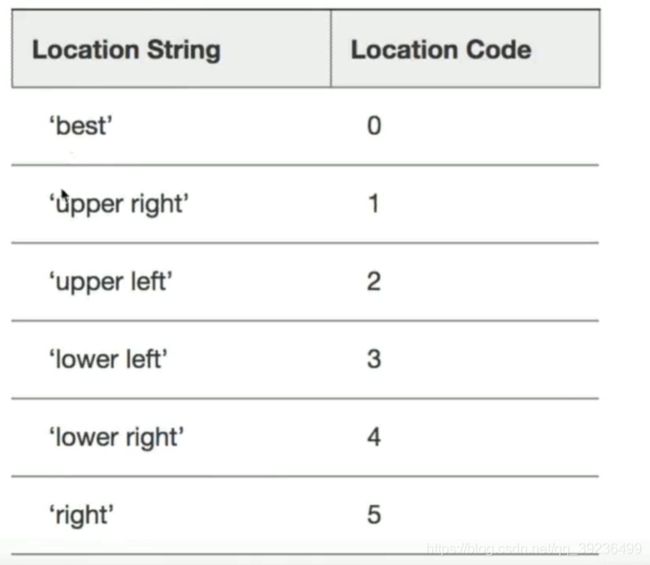
注意:如果只在plt.plot()中设置label还不能最终显示出图例,还需要通过plt.legend()将图例显示出来。
plt.legend(loc='best')
import matplotlib.pyplot as plt
import random
from matplotlib.font_manager import FontProperties  # 字体管理器
#font = FontProperties(fname="C:\\Windows\\Fonts\\simsunb.ttf", size=15)  # 设置汉字格式
# 需求 :画出城市11点到12点1小时内每分钟的温度变化折线图,范围在15~18度
# 1、准备数据 x,y
x = range(60)
y_shanghai = [random.uniform(15, 18) for i in x]
y_beijing = [random.uniform(1, 3) for j in x]

# 2、创建画布
plt.figure(figsize=(20,8), dpi=80)
# 3、绘制图像
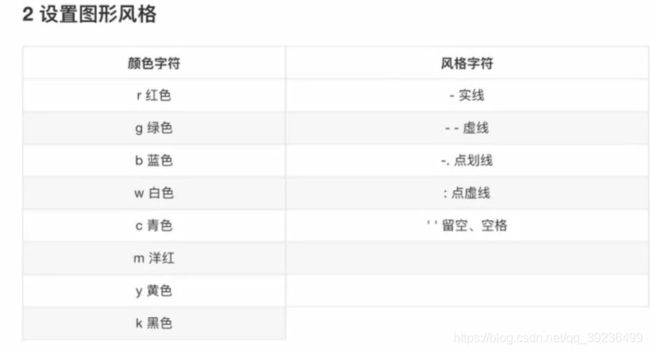
plt.plot(x, y_shanghai, color="r", linestyle='-.', label='shanghai')
plt.plot(x, y_beijing, color='b', label='beijing')

# 显示图例
plt.legend(loc='lower right')

# 修改x,y刻度
# 准备x的刻度说明
x_label = ["11:{}".format(i) for i in x]
plt.xticks(x[::5], x_label[::5])
plt.yticks(range(40)[::5])  # y刻度

# 添加网格显示
plt.grid(True, linestyle='--', alpha=0.5)

# 添加标题
plt.xlabel("time")
plt.ylabel("temperature")
plt.title("figure_1")

# 4、显示图像
plt.show()
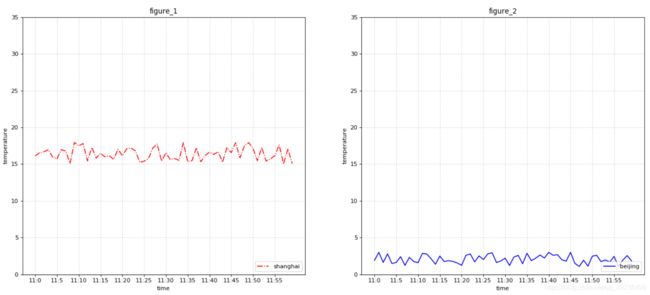
2.2.4 多个坐标系显示:plt.subplots(面向对象的画图方法)
import matplotlib.pyplot as plt
import random
from matplotlib.font_manager import FontProperties  # 字体管理器
#font = FontProperties(fname="C:\\Windows\\Fonts\\simsunb.ttf", size=15)  # 设置汉字格式
# 需求 :画出城市11点到12点1小时内每分钟的温度变化折线图,范围在15~18度

# 1、准备数据 x,y
x = range(60)
y_shanghai = [random.uniform(15, 18) for i in x]
y_beijing = [random.uniform(1, 3) for j in x]

# 2、创建画布
#plt.figure(figsize=(20,8), dpi=80)
figure, axes = plt.subplots(nrows=1, ncols=2, figsize=(20,8), dpi=80)

# 3、绘制图像
axes[0].plot(x, y_shanghai, color="r", linestyle='-.', label='shanghai')
axes[1].plot(x, y_beijing, color='b', label='beijing')

# 显示图例
axes[0].legend(loc='lower right')
axes[1].legend(loc='lower right')

# 修改x,y刻度
# 准备x的刻度说明
x_label = ["11:{}".format(i) for i in x]
axes[0].set_xticks(x[::5])
axes[0].set_xticklabels(x_label[::5])
axes[0].set_yticks(range(40)[::5])  # y刻度
axes[1].set_xticks(x[::5])
axes[1].set_xticklabels(x_label[::5])
axes[1].set_yticks(range(40)[::5])  # y刻度

# 添加网格显示
axes[0].grid(True, linestyle='--', alpha=0.5)
axes[1].grid(True, linestyle='--', alpha=0.5)

# 添加标题
axes[0].set_xlabel("time")
axes[0].set_ylabel("temperature")
axes[0].set_title("figure_1")
axes[1].set_xlabel("time")
axes[1].set_ylabel("temperature")
axes[1].set_title("figure_2")

# 4、显示图像
plt.show()
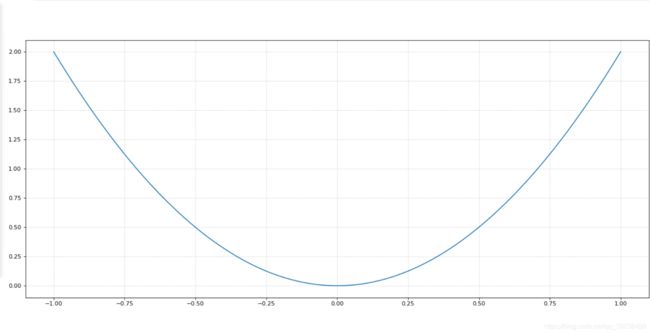
2.2.5 折线图的应用场景
import matplotlib.pyplot as plt
import random
import numpy as np
# 绘制数学函数图像
# 1、准备x,y数据
x = np.linspace(-1,1,1000)
y = 2 * x * x

# 2、创建画布
plt.figure(figsize=(20,8), dpi=80)

# 3、绘制图像
plt.plot(x,y)

# 添加网格显示
plt.grid(linestyle='--', alpha=0.5)

# 4、显示图像
plt.show()
2.3 散点图(scatter)
2.3.1 常见图像种类及意义
2.3.2 散点图绘制
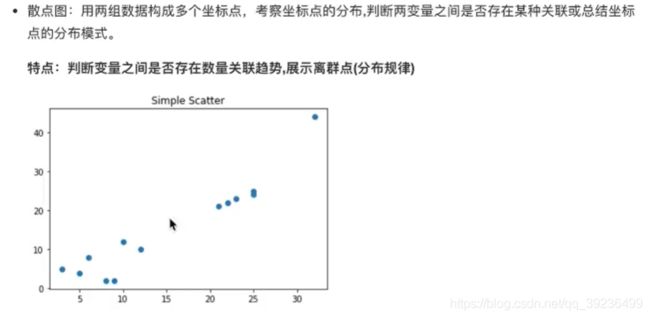
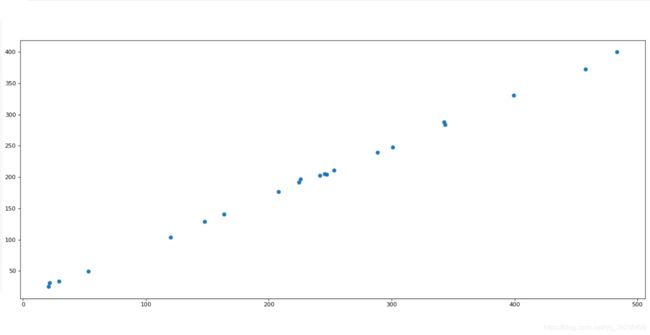
需求:探究房屋面积与房屋价格的关系
import matplotlib.pyplot as plt
import random
import numpy as np
# 需求:探究房屋面积和房屋价格的关系

# 1、准备数据
x = [225.98, 247.07, 253.14, 457.85, 241.58, 301.01, 20.67, 288.64,
     163.56, 120.06, 207.83, 342.75, 147.9, 53.06, 224.72, 29.51,
     21.61, 483.21, 245.25, 399.25, 343.35]
y = [196.63, 203.88, 210.75, 372.74, 202.41, 247.61, 24.9, 239.34,
     140.32, 104.15, 176.84, 288.23, 128.79, 49.64, 191.74, 33.1,
     30.74, 400.02, 205.35, 330.64, 283.45]

# 2、创建画布
plt.figure(figsize=(20,8), dpi=80)
# 3、绘制图像
plt.scatter(x,y)
# 4、显示图像
plt.show()
2.4 柱状图(bar)
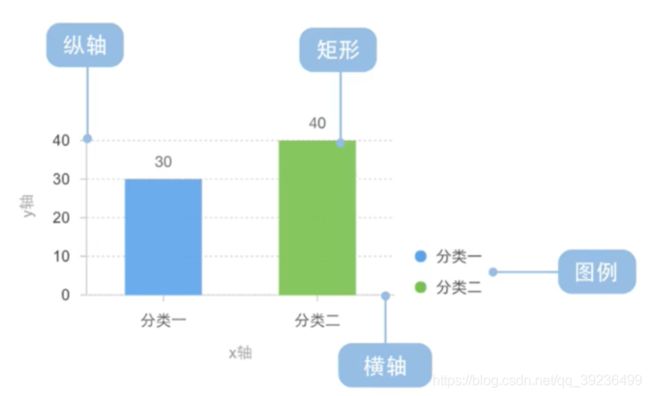
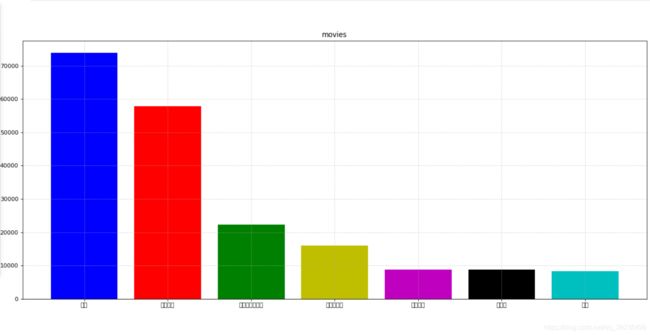
2.4.1 柱状图绘制
代码如下:
import matplotlib.pyplot as plt
import random
import numpy as np

# 1、准备数据
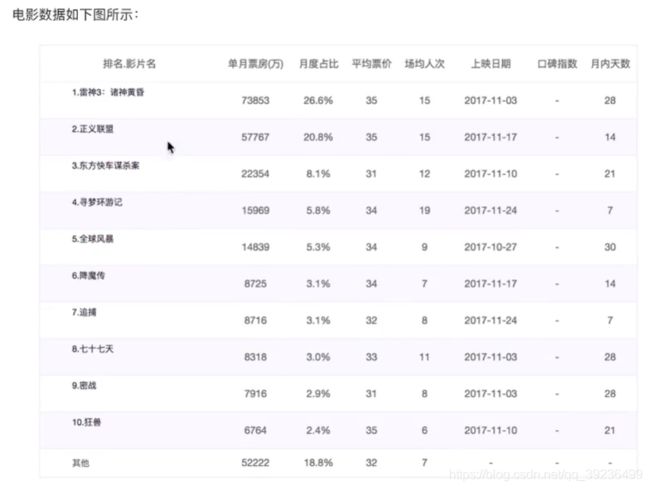
movie_names = ['雷神', '正义联盟', '东方快车谋杀案', '寻梦环游记', '全球风暴', '降魔传', '追捕']
tickets = [73853, 57767, 22354, 15969, 8725, 8716, 8318]

# 2、创建画布
plt.figure(figsize=(20,8), dpi=80)

# 3、绘制柱状图
x_ticks = range(len(movie_names))
plt.bar(x_ticks, tickets, color=['b', 'r', 'g', 'y', 'm', 'k', 'c'])

# 修改x刻度
plt.xticks(x_ticks, movie_names)

# 添加标题
plt.title("movies")

# 添加网格
plt.grid(linestyle='--', alpha=0.5)

# 4、显示图像
plt.show()
需求二:如何对比电影票房收入才更加有说服力
比较相同天数的票房

import matplotlib.pyplot as plt
import random
import numpy as np

# 1、准备数据
movie_name = ['雷神', '正义联盟', '寻梦环游记']
first_day = [10587.6, 10062.5, 1275.7]
first_weekday = [36224.9, 34479.6, 11830]

# 2、创建画布
plt.figure(figsize=(20,8), dpi=80)

# 3、绘制柱状图
plt.bar(range(len(movie_name)), first_day, width=0.2, label="first_day")
plt.bar([0.2, 1.2, 2.2], first_weekday, width=0.2, label='first_weekday')

plt.legend()  # 显示图例

# 修改刻度
plt.xticks([0.1, 1.1, 2.1], movie_name)

# 4、显示图像
plt.show()
2.5 直方图(histogram)
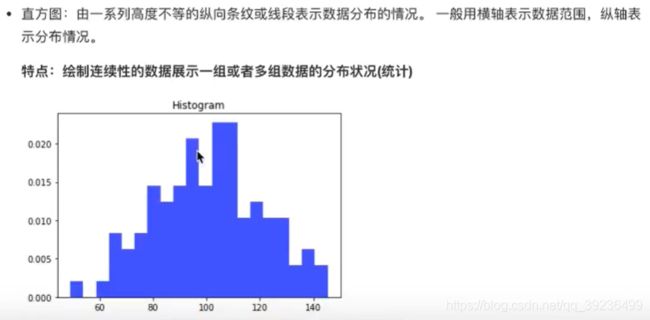
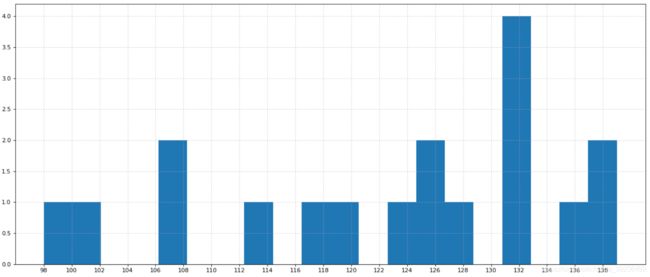
2.5.1 直方图介绍
2.5.3 直方图绘制
import matplotlib.pyplot as plt
import random
import numpy as np
# 需求:电影时长分布状况

# 1、准备数据
time = [131, 98, 125, 131, 124, 139, 131, 117, 128, 108, 135, 138, 131, 102, 107, 114, 119, 125]

# 2、创建画布
plt.figure(figsize=(20,8), dpi=80)

# 3、绘制柱状图
distance = 2
group_num = int((max(time) - min(time)) / distance)
plt.hist(time, bins=group_num)

# 修改x轴刻度
plt.xticks(range(min(time), max(time), distance))

# 添加网格
plt.grid(linestyle='--', alpha=0.5)

# 4、显示图像
plt.show()
2.6 饼图(pie)
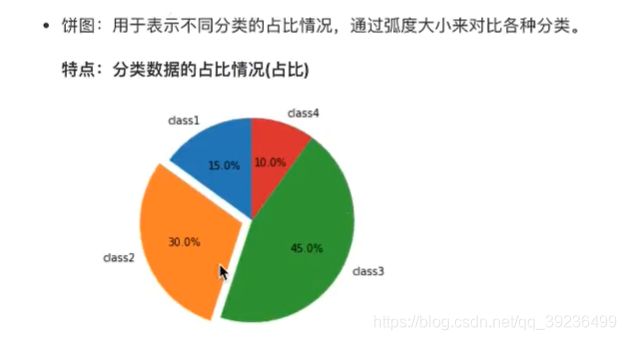
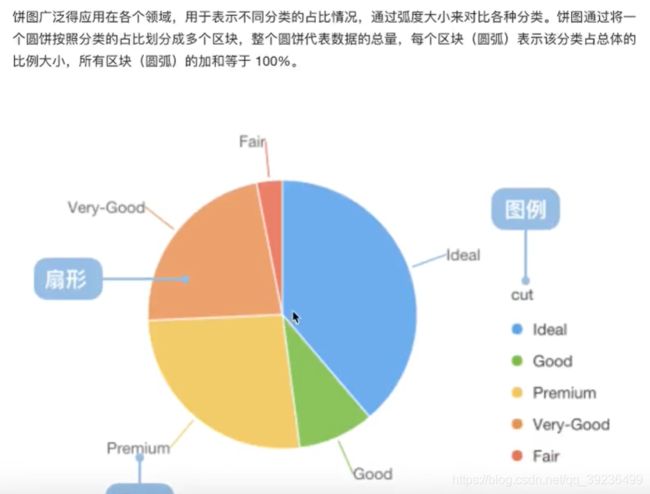
2.6.1 饼图介绍
2.6.2 饼图绘制
需求:显示不同的电影的排片占比
import matplotlib.pyplot as plt
import random
import numpy as np
# 需求:显示不同的电影的排片占比

# 1、准备数据
movie_names = ['雷神', '正义联盟', '东方快车谋杀案', '寻梦环游记', '全球风暴', '降魔传', '追捕']
place_count = [73853, 57767, 22354, 15969, 8725, 8716, 8318]

# 2、创建画布
plt.figure(figsize=(20,8), dpi=80)

# 3、绘制柱状图
plt.pie(place_count, labels=movie_names,
        colors=['b', 'r', 'g', 'y', 'm', 'k', 'c'], autopct='%1.2f%%')

# 显示图例
plt.legend()

plt.axis('equal')

# 4、显示图像
plt.show()

