数据科学【四】:基本可视化(二)
数据科学【四】:基本可视化(二)
本次数据使用爱彼迎租房数据(Airbnb dataset)。我们只采用listing.csv, 可以直接从这里下载。
热度图绘制
使用Folium包绘制热度图。由于它集成了leaflet,查看其绘制的图像可能需要。
Folium安装
pip install folium
使用folium在地图上绘制热度图
示例:在纽约地图上绘制各地区(各经纬度)房价平均值
import folium
from folium.plugins import HeatMap
import pandas as pd

nyc_base = [40.693943, -73.985880]

airbnb_df = pd.read_csv("listings.csv")
price_data = airbnb_df[['latitude', 'longitude', 'price']].values.tolist()
map_nyc = folium.Map(nyc_base, zoom_start=8)
HeatMap(price_data).add_to(map_nyc)

map_nyc.save("map_1a.html")
在相同路径下会产生一个map_1a.html的文件,使用浏览器打开即可看到如下热图
如前文所述,可能需要挂梯子。
示例:使用平均值与标准差正则化价格,绘制调整后价格的热图。
price_df = airbnb_df[['latitude', 'longitude', 'price']]
price_df['price'] = (price_df['price'] - price_df['price'].mean())/price_df['price'].std()
price_data = price_df.values.tolist()

map_nyc1 = folium.Map(nyc_base, zoo_start = 8)
HeatMap(price_data).add_to(map_nyc1)


map_nyc1.save("map_1b.html")
示例:使用sklearn的MinMaxScaler正则化,并绘制价格热度图
from sklearn.preprocessing import MinMaxScaler

price_df = airbnb_df[['latitude', 'longitude', 'price']]
prices = price_df['price'].values.reshape(-1, 1)
ms = MinMaxScaler(feature_range = (0, 1))
prices_norm = ms.fit_transform(prices)
price_df['price'] = pd.Series(prices_norm.reshape(1, -1)[0])

price_data = price_df.values.tolist()
map_nyc2 = folium.Map(nyc_base, zoo_start = 8)
HeatMap(price_data).add_to(map_nyc2)

map_nyc1.save("map_1c.html")
复习:绘制条形图
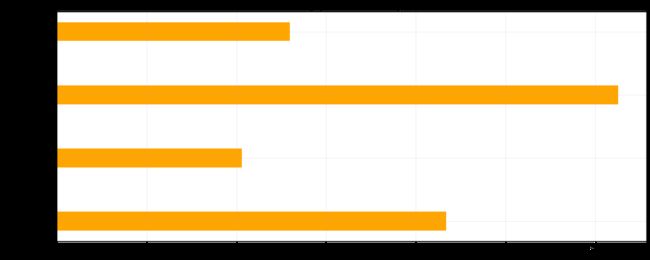
绘制不同种类房间的平均价格条形图
from matplotlib import pyplot as plt
import matplotlib

avg_entire = airbnb_df[airbnb_df.room_type == 'Entire home/apt']['price'].mean()
avg_private = airbnb_df[airbnb_df.room_type == 'Private room']['price'].mean()
avg_hotel = airbnb_df[airbnb_df.room_type == 'Hotel room']['price'].mean()
avg_shared = airbnb_df[airbnb_df.room_type == 'Shared room']['price'].mean()

labels = ['Entire home/apt', 'Private room', 'Hotel room', 'Shared room']
datas = [avg_entire, avg_private, avg_hotel, avg_shared]

plt.figure(figsize=(20, 8), dpi=80)
plt.barh(range(4), datas, height=0.3, color='orange')
plt.yticks(range(4), labels)
plt.grid(alpha=0.3)

plt.ylabel("Room Type")
plt.xlabel("Average Price")
plt.title("Average price of different room types")

plt.show()
使用folium在地图上标记点
使用folium的Marker可在地图上标记一个点,如下图:

当然,标记的形状是可以更换的,也可以添加标记点的描述,可以查看folium官方文档。
示例:绘制价格最高的10处房产
price_sorted_df = airbnb_df.sort_values(by='price', ascending=False, inplace=False).head(20)

price_data = price_sorted_df[['latitude', 'longitude']].values.tolist()
u_price_data = []
for c in price_data:
    if len(u_price_data)>10:
        break
    else:
        if c not in u_price_data:
            u_price_data.append(c)
map_nyc_e = folium.Map(nyc_base, zoom_start=8)
for coord in u_price_data:
    folium.Marker(coord).add_to(map_nyc_e)

map_nyc_e.save("map_1e.html")
示例:绘制浏览量最大的10处房产
reviewed_sorted_df = airbnb_df.sort_values(by='number_of_reviews', ascending=False, inplace=False).head(20)

review_data = reviewed_sorted_df[['latitude', 'longitude']].values.tolist()
u_review_data = []
for c in review_data:
    if len(u_review_data)>10:
        break
    else:
        if c not in u_review_data:
            u_review_data.append(c)
map_nyc_f = folium.Map(nyc_base, zoom_start=8)
for coord in u_review_data:
    folium.Marker(coord).add_to(map_nyc_f)

map_nyc_f.save("map_1f.html")
示例:绘制最空闲的10处房产
available_sorted_df =airbnb_df.sort_values(by='availability_365', ascending = False, inplace=False).head(20)

available_data = available_sorted_df[['latitude', 'longitude']].values.tolist()
u_available_data = []
for c in available_data:
    if len(u_available_data)>10:
        break
    else:
        if c not in u_available_data:
            u_available_data.append(c)
map_nyc_g = folium.Map(nyc_base, zoom_start=8)
for coord in u_available_data:
    folium.Marker(coord).add_to(map_nyc_g)

map_nyc_g.save("map_1g.html")
