用Matplotlib和Seaborn这类Python库可以画出很好看的图,但是这些图只是静态的,难以动态且美观地呈现数值变化。要是在你下次的演示、视频、社交媒体Po文里能用短视频呈现数据变化,是不是很赞呢?更棒的是,你还是可以在你的图表上用Matplotlib、Seaborn或者其他库!
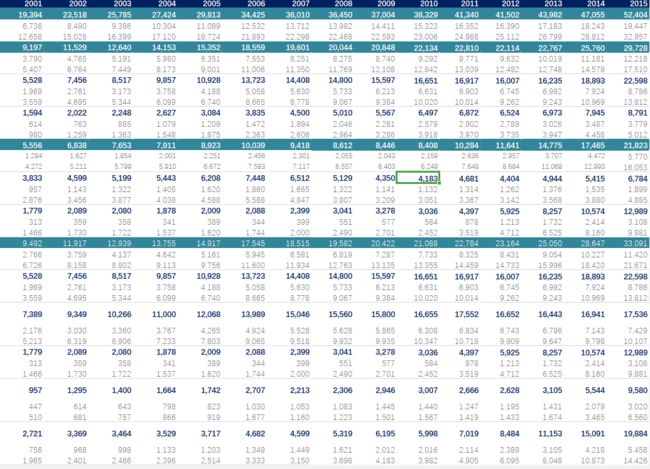
本文将使用美国国家药物滥用研究所和疾病预防控制中心公布的阿片类药物数据,可在此处下载:https://http://www.drugabuse.gov/sites/default/files/overdosedata1999-2015.xls
我们会用到的数据是这样的:
我们将用Matplotlib和Seaborn绘图,用Numpy和Pandas处理数据。Matplotlib也提供了一些我们做动画可以的函数,所以让我们首先导入所有依赖项。
import numpy as np
import pandas as pd
import seaborn as sns
import matplotlib
import matplotlib.pyplot as plt
import matplotlib.animation as animation
然后用Pandas载入数据并转成DataFrame类型的数据结构。因为我们要针对不同阿片类药物的滥用画图,写个函数来载入感兴趣的特定行的数据能避免重复代码。(小编注:原文提供的代码在读取excel文件的时候使用了已废弃的sheetname参数,本文中已修正为sheet_name)
overdoses = pd.read_excel('overdose_data_1999-2015.xls',sheet_name='Online',skiprows =6)
def get_data(table,rownum,title):
    data = pd.DataFrame(table.loc[rownum][2:]).astype(float)
    data.columns = {title}
 return data
现在让我们来做动画吧!
首先,如果你和我一样使用的是jupyter notebook,请在代码首行加入 %matplotlib notebook,如此便可在notebook直接看到生成的动画而非保存后才可见。
我现在使用 get_data函数从表中检索海洛因过量的数据并放在有两列的Pandas DataFrame中,一列是年,一列是过量死亡的人数。
%matplotlib notebook
title = 'Heroin Overdoses'
d = get_data(overdoses,18,title)
x = np.array(d.index)
y = np.array(d['Heroin Overdoses'])
overdose = pd.DataFrame(y,x)
#XN,YN = augment(x,y,10)
#augmented = pd.DataFrame(YN,XN)
overdose.columns = {title}
接下来我们初始化一个ffmpeg Writer并以20帧每秒、1800比特率进行录屏。你也可以根据喜好自行设置这些值。
Writer = animation.writers['ffmpeg']
writer = Writer(fps=20, metadata=dict(artist='Me'), bitrate=1800)
(小编注:如果出现 RuntimeError:RequestedMovieWriter(ffmpeg)notavailable的报错,请自行安装ffmpeg,装了brew的Mac可以直接: brew install ffmpeg)
现在我们创建一个有几个标签的图形。确保设置x和y轴的限制,以免动画随当前显示的数据范围乱跳转。
fig = plt.figure(figsize=(10,6))
plt.xlim(1999, 2016)
plt.ylim(np.min(overdose)[0], np.max(overdose)[0])
plt.xlabel('Year',fontsize=20)
plt.ylabel(title,fontsize=20)
plt.title('Heroin Overdoses per Year',fontsize=20)
动画的核心是动画函数,你可以在其中定义视频的每一帧发生什么。这里的 i表示动画中帧的索引。使用这个索引可以选择应在此帧中可见的数据范围。然后我使用seaborn线图来绘制所选的数据。最后两行代码只是为了让图表更美观。
def animate(i):
    data = overdose.iloc[:int(i+1)] #选择数据范围
    p = sns.lineplot(x=data.index, y=data[title], data=data, color="r")
    p.tick_params(labelsize=17)
    plt.setp(p.lines,linewidth=7)
我们用调用了 animate 函数并定义了帧数的 matplotlib.animation.FuncAnimation来开始动画, frames实际上定义了调用 animate的频率。
ani = matplotlib.animation.FuncAnimation(fig, animate, frames=17, repeat=True)
你可以用 ani.save()把动画保存为mp4,如果你想直接看一看动画效果可以用plt.show() 。
ani.save('HeroinOverdosesJumpy.mp4', writer=writer)
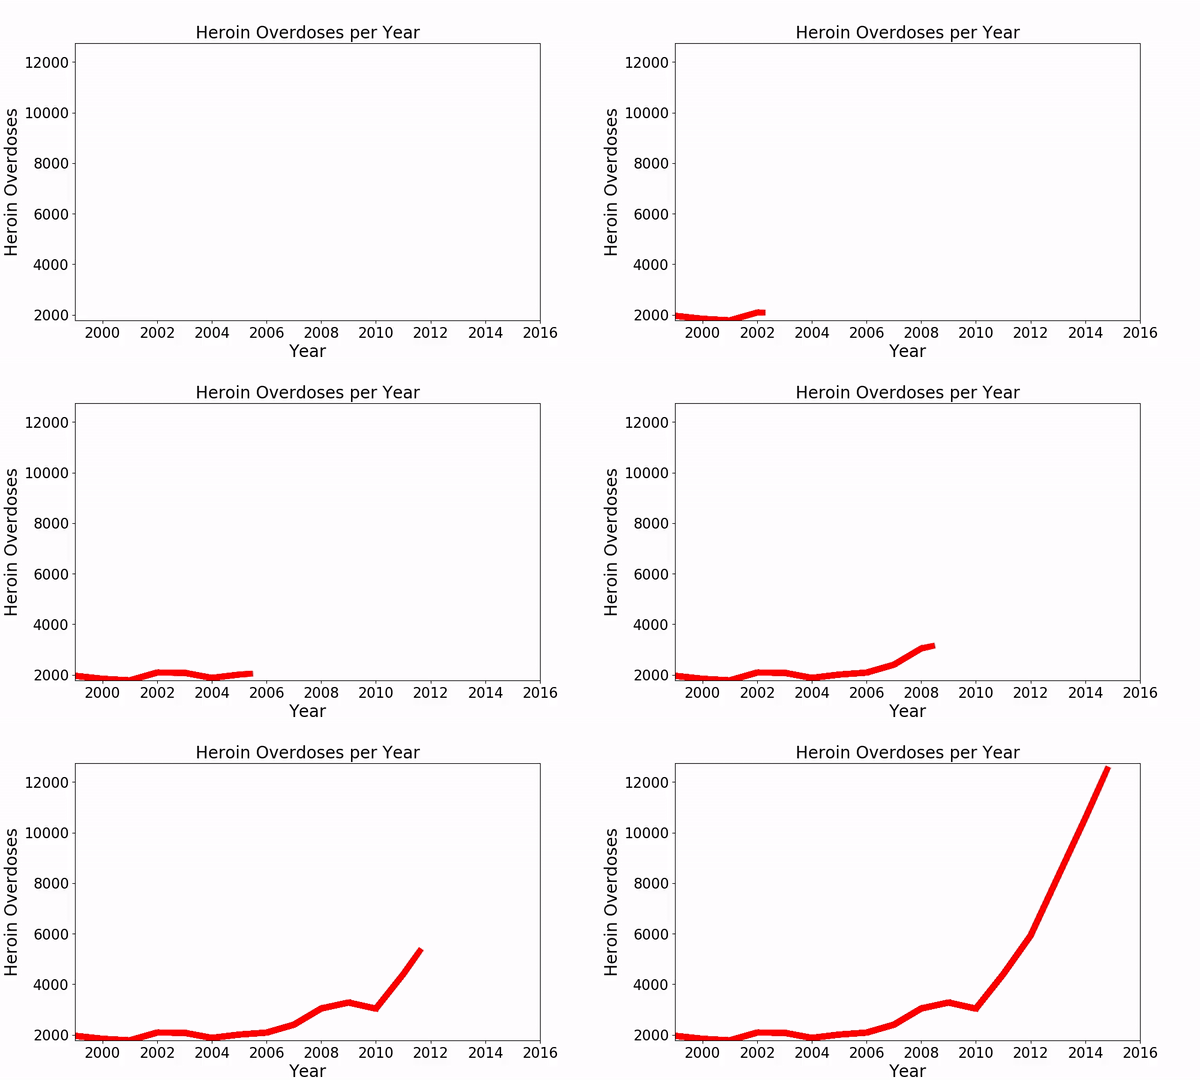
现在我们的图表动起来啦:
动画能够正常运行但是感觉有点跳跃,所以我们需要在已有数据点之间增加更多的数据点来使动画的过渡平滑。于是我们使用另一个函数 augment。
def augment(xold,yold,numsteps):
    xnew = []
    ynew = []
 for i in range(len(xold)-1):
        difX = xold[i+1]-xold[i]
        stepsX = difX/numsteps
        difY = yold[i+1]-yold[i]
        stepsY = difY/numsteps
 for s in range(numsteps):
            xnew = np.append(xnew,xold[i]+s*stepsX)
            ynew = np.append(ynew,yold[i]+s*stepsY)
 return xnew,ynew
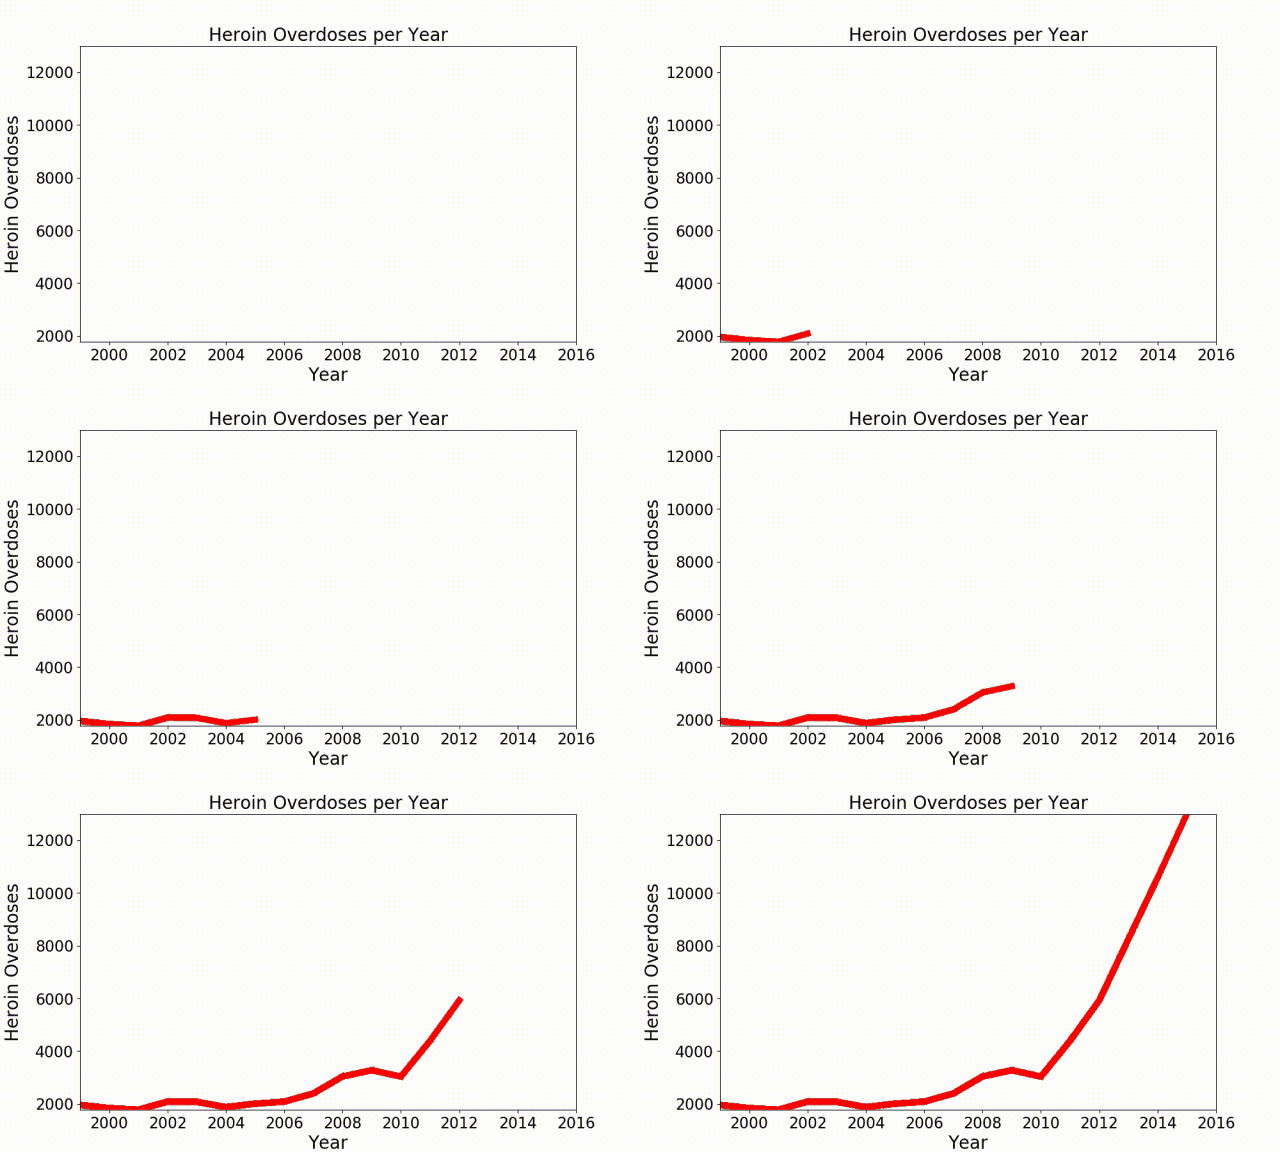
现在我们只需要对我们的数据应用这个函数、增加 matplotlib.animation.FuncAnimation 函数的帧数。在这里我用参数 numsteps=10调用 augment函数,也就是增加数据点至160个,并且设置 frames=160 。这样以来,图表显得更为平滑,但还是在数值变动处有些突兀。
为了让我们的动画更平滑美观,我们可以增加一个平滑函数(具体请见:https://www.swharden.com/wp/2008-11-17-linear-data-smoothing-in-python/ )。
def smoothListGaussian(listin,strippedXs=False,degree=5):
    window=degree*2-1
    weight=np.array([1.0]*window)
    weightGauss=[]
 for i in range(window):
        i=i-degree+1
        frac=i/float(window)
        gauss=1/(np.exp((4*(frac))**2))
        weightGauss.append(gauss)
    weight=np.array(weightGauss)*weight
    smoothed=[0.0]*(len(listin)-window)
 for i in range(len(smoothed)):
    smoothed[i]=sum(np.array(listin[i:i+window])*weight)/sum(weight)
 return smoothed
另外我们也可以加上一点颜色和样式参数,让图表更个性化。
sns.set(rc={'axes.facecolor':'lightgrey', 'figure.facecolor':'lightgrey','figure.edgecolor':'black','axes.grid':False})
当当当!如此我们便得到了文章开头的动画图表。
这篇文章仅仅只是matplotlib动画功能的一个例子,你大可以用它来实现任何一种图表的动画效果。简单调整 animate()函数内的参数和图表类型,就能得到无穷无尽的可能性。
到此这篇关于利用 Python 让图表动起来的文章就介绍到这了,更多相关Python 让图表动起来内容请搜索脚本之家以前的文章或继续浏览下面的相关文章希望大家以后多多支持脚本之家!


