python 使用pyecharts绘制折线图
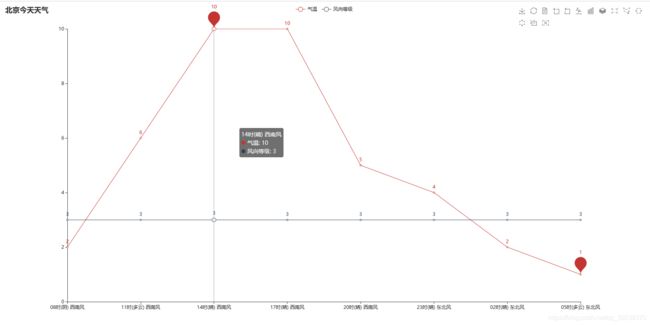
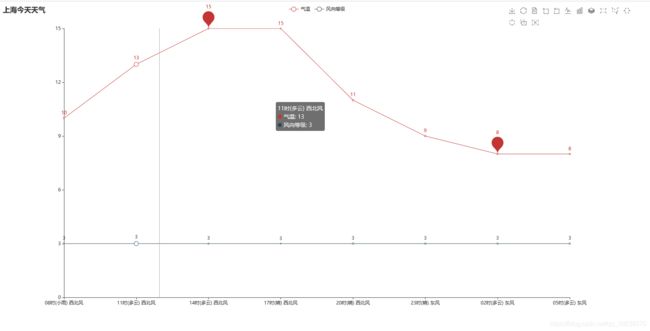
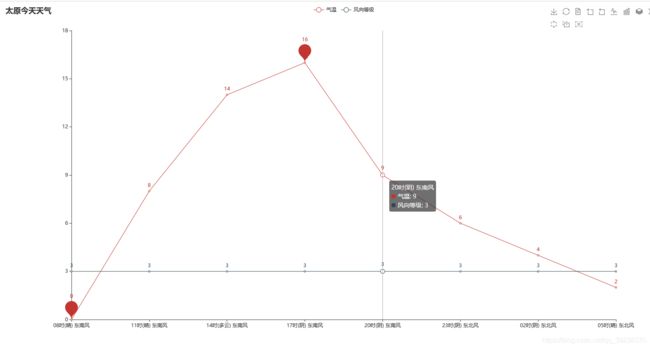
根据上篇搞到数据,绘制当天天气折线图。
也可以修改下改成Html解析数据然后组合数据放到图上就可以啦。
pyecharts文档:https://gallery.pyecharts.org/#/Line/temperature_change_line_chart
一、无图无真相
二、代码
import re
import pyecharts.options as opts
from pyecharts.charts import Line
import pymongo

mongo = pymongo.MongoClient(host="localHost", port=27017)  # 连接数据库
db = mongo["python"]  # 获取数据库
weatherInfoCollection = db["weather_info"]


def draw_line(times, tems, winls, city):
    (
        Line(init_opts=opts.InitOpts(width="1600px", height="800px"))
            .add_xaxis(xaxis_data=times)
            .add_yaxis(series_name="气温",
                       y_axis=tems,
                       markpoint_opts=opts.MarkLineOpts(
                           data=[
                               opts.MarkLineItem(type_="max", name="最高温度"),
                               opts.MarkLineItem(type_="min", name="最低温度")
                           ]
                       ))
            .add_yaxis(series_name="风向等级",
                       y_axis=winls,
                       markpoint_opts=opts.MarkPointOpts(
                           data=[opts.MarkPointItem(value=-2, name="周最低", x=1, y=-1.5)]
                       ), )
            .set_global_opts(
            title_opts=opts.TitleOpts(title=city + "今天天气"),
            tooltip_opts=opts.TooltipOpts(trigger="axis"),
            toolbox_opts=opts.ToolboxOpts(is_show=True),
            xaxis_opts=opts.AxisOpts(type_="category", boundary_gap=False),
        ).render("temperature_change_line_chart.html")
    )


def select(city):
    global weatherInfoCollection
    current = weatherInfoCollection.find_one({"address": city})
    return current["weather"]


if __name__ == "__main__":
    times = []
    tems = []
    winfs = []
    winls = []
    wpics = []
    print("输入省份:")
    city = input()
    weathers = select(city)
    for weather in weathers:
        print(weather)
        times.append(weather['times'] + "({})".format(weather['wpics']) + " " + weather['winfs'])
        tems.append(re.findall(r'\d+', weather['tems'])[0])
        winls.append(re.findall(r'\d+', weather['winls'])[0])
    draw_line(times, tems, winls, city)
超级简单就是从数据库查询数据然后给图表赋值,charts文档写的很清楚了,根据需要选择对应的图就可以啦。


