darknet的yolov3测试以及评价指标
(转)ubuntu18.04下darknet的yolov3测试以及评价指标
- yolov3测试及评价
-
- 训练可视化(Avg_loss Avg IOU)
-
- 方法一
- 方法二
-
- 第一步、格式化log
- 第二步、绘制loss
- 第三步、绘制Avg IOU
- 批量测试
-
- 第一种、生成测试集的txt文件
-
- 命令如下
- 执行命令
- 第二种、一、生成测试集的测试图片
-
- 1)替换detector.c
- 2)修改detector.c
- 3)make
- 4)开始批量测试
- AP,mAP计算
-
- 一、准备
- 二、生成pkl
- 三、绘制PR曲线
yolov3测试及评价
参考一些博客,自己只是整理一下,参考博客如下:
参考
参考2
训练可视化(Avg_loss Avg IOU)
方法一
再开始训练的时候,采用保存训练日志的训练命令:
./darknet detector train cfg/voc.data cfg/yolov3-voc.cfg scripts/darknet53.conv.74 | tee train_yolov3-voc.log
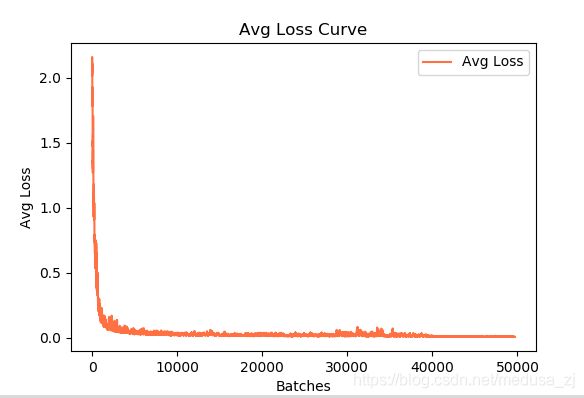
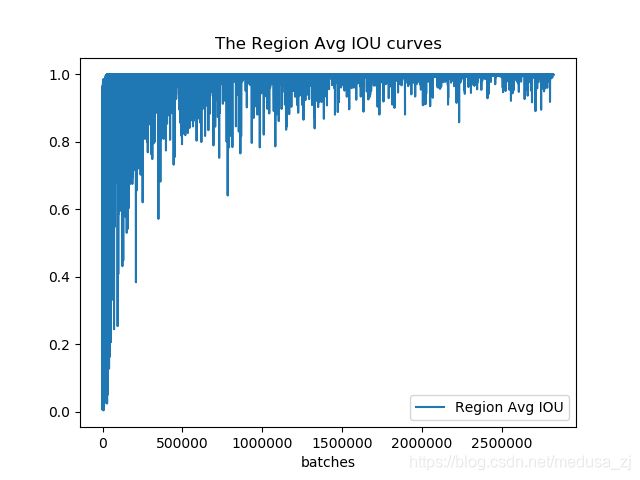
使用以下python脚本对训练日志进行可视化,得到loss变化曲线和Avg IOU曲线(Avg IOU是标记的框和预测的框重复的部分除以他们的和,这个值越接近1越好)。将以下python脚本文件和训练日志log放在同一目录下,打开此目录下的终端,运行visualization_train_yolov3-voc_log.py文件可以得到loss变化曲线和Avg IOU变化曲线。同时,在当前目录下生成了train_log_iou.txt和train_log_loss.txt文件。
visualization_train_yolov3-voc_log.py的代码如下:
# -*- coding: utf-8 -*-
# @Func    :yolov3 训练日志可视化,把该脚本和日志文件放在同一目录下运行。

import pandas as pd
import matplotlib.pyplot as plt
import os

# ==================可能需要修改的地方=====================================#
g_log_path = "train_yolov3-voc.log"  # 此处修改为你的训练日志文件名
# ==========================================================================#

def extract_log(log_file, new_log_file, key_word):
    '''
    :param log_file:日志文件
    :param new_log_file:挑选出可用信息的日志文件
    :param key_word:根据关键词提取日志信息
    :return:
    '''
    with open(log_file, "r") as f:
        with open(new_log_file, "w") as train_log:
            for line in f:
                # 去除多gpu的同步log
                if "Syncing" in line:
                    continue
                # 去除nan log
                if "nan" in line:
                    continue
                if key_word in line:
                    train_log.write(line)
    f.close()
    train_log.close()


def drawAvgLoss(loss_log_path):
    '''
    :param loss_log_path: 提取到的loss日志信息文件
    :return: 画loss曲线图
    '''
    line_cnt = 0
    for count, line in enumerate(open(loss_log_path, "rU")):
        line_cnt += 1
    result = pd.read_csv(loss_log_path, skiprows=[iter_num for iter_num in range(line_cnt) if ((iter_num < 500))],
                         error_bad_lines=False,
                         names=["loss", "avg", "rate", "seconds", "images"])
    result["avg"] = result["avg"].str.split(" ").str.get(1)
    result["avg"] = pd.to_numeric(result["avg"])

    fig = plt.figure(1, figsize=(6, 4))
    ax = fig.add_subplot(1, 1, 1)
    ax.plot(result["avg"].values, label="Avg Loss", color="#ff7043")
    ax.legend(loc="best")
    ax.set_title("Avg Loss Curve")
    ax.set_xlabel("Batches")
    ax.set_ylabel("Avg Loss")


def drawIOU(iou_log_path):
    '''
    :param iou_log_path: 提取到的iou日志信息文件
    :return: 画iou曲线图
    '''
    line_cnt = 0
    for count, line in enumerate(open(iou_log_path, "rU")):
        line_cnt += 1
    result = pd.read_csv(iou_log_path, skiprows=[x for x in range(line_cnt) if (x % 39 != 0 | (x < 5000))],
                         error_bad_lines=False,
                         names=["Region Avg IOU", "Class", "Obj", "No Obj", "Avg Recall", "count"])
    result["Region Avg IOU"] = result["Region Avg IOU"].str.split(": ").str.get(1)

    result["Region Avg IOU"] = pd.to_numeric(result["Region Avg IOU"])

    result_iou = result["Region Avg IOU"].values
    # 平滑iou曲线
    for i in range(len(result_iou) - 1):
        iou = result_iou[i]
        iou_next = result_iou[i + 1]
        if abs(iou - iou_next) > 0.2:
            result_iou[i] = (iou + iou_next) / 2

    fig = plt.figure(2, figsize=(6, 4))
    ax = fig.add_subplot(1, 1, 1)
    ax.plot(result_iou, label="Region Avg IOU", color="#ff7043")
    ax.legend(loc="best")
    ax.set_title("Avg IOU Curve")
    ax.set_xlabel("Batches")
    ax.set_ylabel("Avg IOU")


if __name__ == "__main__":
    loss_log_path = "train_log_loss.txt"
    iou_log_path = "train_log_iou.txt"
    if os.path.exists(g_log_path) is False:
        exit(-1)
    if os.path.exists(loss_log_path) is False:
        extract_log(g_log_path, loss_log_path, "images")
    if os.path.exists(iou_log_path) is False:
        extract_log(g_log_path, iou_log_path, "IOU")
    drawAvgLoss(loss_log_path)
    drawIOU(iou_log_path)
    plt.show()
方法二
第一步、格式化log
使用extract_log.py脚本,格式化log,用生成的新的log文件供可视化工具绘图,格式化log的extract_log.py脚本如下(和生成的log文件同一目录)
# coding=utf-8
# 该文件用来提取训练log,去除不可解析的log后使log文件格式化,生成新的log文件供可视化工具绘图

import inspect
import os
import random
import sys
def extract_log(log_file,new_log_file,key_word):
    with open(log_file, 'r') as f:
      with open(new_log_file, 'w') as train_log:
  #f = open(log_file)
    #train_log = open(new_log_file, 'w')
        for line in f:
    # 去除多gpu的同步log
          if 'Syncing' in line:
            continue
    # 去除除零错误的log
          if 'nan' in line:
            continue
          if key_word in line:
            train_log.write(line)
    f.close()
    train_log.close()

extract_log('train_yolov3.log','train_log_loss.txt','images')
extract_log('train_yolov3.log','train_log_iou.txt','IOU')
运行之后,会解析log文件的loss行和iou行得到两个txt文件
第二步、绘制loss
使用train_loss_visualization.py脚本可以绘制loss变化曲线 。
train_loss_visualization.py脚本如下(也是同一目录新建py文件):
# coding=utf-8
import pandas as pd
import numpy as np
import matplotlib.pyplot as plt
#%matplotlib inline

lines =5124    #改为自己生成的train_log_loss.txt中的行数
result = pd.read_csv('train_log_loss.txt', skiprows=[x for x in range(lines) if ((x%10!=9) |(x<1000))] ,error_bad_lines=False, names=['loss', 'avg', 'rate', 'seconds', 'images'])
result.head()

result['loss']=result['loss'].str.split(' ').str.get(1)
result['avg']=result['avg'].str.split(' ').str.get(1)
result['rate']=result['rate'].str.split(' ').str.get(1)
result['seconds']=result['seconds'].str.split(' ').str.get(1)
result['images']=result['images'].str.split(' ').str.get(1)
result.head()
result.tail()

# print(result.head())
# print(result.tail())
# print(result.dtypes)

print(result['loss'])
print(result['avg'])
print(result['rate'])
print(result['seconds'])
print(result['images'])

result['loss']=pd.to_numeric(result['loss'])
result['avg']=pd.to_numeric(result['avg'])
result['rate']=pd.to_numeric(result['rate'])
result['seconds']=pd.to_numeric(result['seconds'])
result['images']=pd.to_numeric(result['images'])
result.dtypes


fig = plt.figure()
ax = fig.add_subplot(1, 1, 1)
ax.plot(result['avg'].values,label='avg_loss')
# ax.plot(result['loss'].values,label='loss')
ax.legend(loc='best')  #图列自适应位置
ax.set_title('The loss curves')
ax.set_xlabel('batches')
fig.savefig('avg_loss')
# fig.savefig('loss')
修改train_loss_visualization.py中lines为train_log_loss.txt行数,并根据需要修改要跳过的行数:
skiprows=[x for x in range(lines) if ((x%10!=9) |(x<1000))]
运行train_loss_visualization.py会在脚本所在路径生成avg_loss.png。
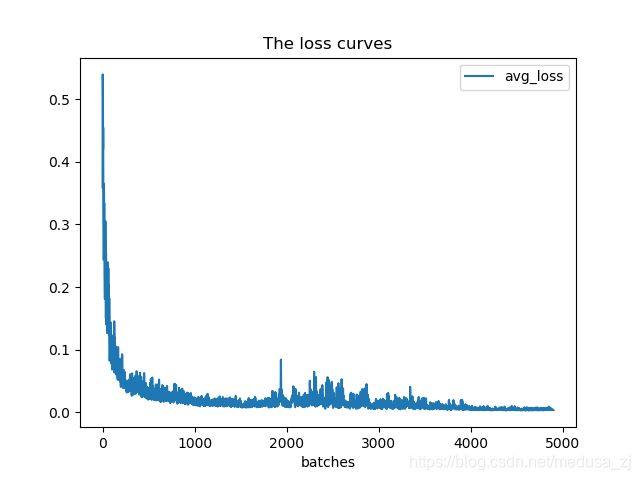 可以通过分析损失变化曲线,修改cfg中的学习率变化策略。
第三步、绘制Avg IOU
train_iou_visualization.py脚本如下(#lines根据train_log_iou.txt的行数修改):
# coding=utf-8
import pandas as pd
import numpy as np
import matplotlib.pyplot as plt
#%matplotlib inline

lines = 122956    #根据train_log_iou.txt的行数修改
result = pd.read_csv('train_log_iou.txt', skiprows=[x for x in range(lines) if (x%10==0 or x%10==9) ] ,error_bad_lines=False, names=['Region Avg IOU', 'Class', 'Obj', 'No Obj', 'Avg Recall','count'])
result.head()

result['Region Avg IOU']=result['Region Avg IOU'].str.split(': ').str.get(1)
result['Class']=result['Class'].str.split(': ').str.get(1)
result['Obj']=result['Obj'].str.split(': ').str.get(1)
result['No Obj']=result['No Obj'].str.split(': ').str.get(1)
result['Avg Recall']=result['Avg Recall'].str.split(': ').str.get(1)
result['count']=result['count'].str.split(': ').str.get(1)
result.head()
result.tail()

# print(result.head())
# print(result.tail())
# print(result.dtypes)
print(result['Region Avg IOU'])

result['Region Avg IOU']=pd.to_numeric(result['Region Avg IOU'])
result['Class']=pd.to_numeric(result['Class'])
result['Obj']=pd.to_numeric(result['Obj'])
result['No Obj']=pd.to_numeric(result['No Obj'])
result['Avg Recall']=pd.to_numeric(result['Avg Recall'])
result['count']=pd.to_numeric(result['count'])
result.dtypes

fig = plt.figure()
ax = fig.add_subplot(1, 1, 1)
ax.plot(result['Region Avg IOU'].values,label='Region Avg IOU')
# ax.plot(result['Class'].values,label='Class')
# ax.plot(result['Obj'].values,label='Obj')
# ax.plot(result['No Obj'].values,label='No Obj')
# ax.plot(result['Avg Recall'].values,label='Avg Recall')
# ax.plot(result['count'].values,label='count')
ax.legend(loc='best')
# ax.set_title('The Region Avg IOU curves')
ax.set_title('The Region Avg IOU curves')
ax.set_xlabel('batches')
# fig.savefig('Avg IOU')
fig.savefig('Region Avg IOU')
批量测试
第一种、生成测试集的txt文件
命令如下
./darknet detector valid cfg/voc.data cfg/yolov3-voc.cfg backup/yolov3-voc_50000.weights
其中:
1、cfg/voc.data 为测试训练路径等配置,这里需要修改,打开如下:
classes= 1
train  = /home/administrator/wy/darknetv3/voc/VOC2021_train.txt
valid  = /home/administrator/wy/darknetv3/voc/VOC2021_val.txt   #你自己的测试图像路径
names = data/voc.names
backup = backup
上述 VOC2021_val.txt 打开如下,注意是绝对路径的那个文件。
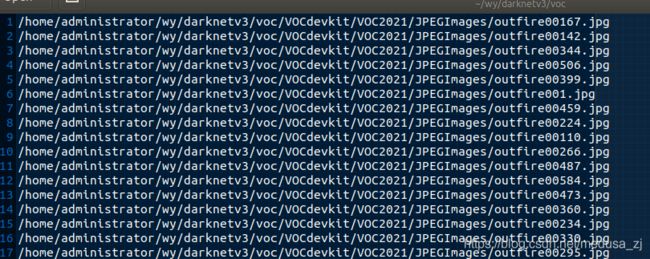
2、backup/yolov3-voc_50000.weights为训练生成的权重,这里需要修改 。
执行命令
如下:

执行完在./results/comp4_det_test_[类名].txt里会保存测试结果
对于以上每个文件打开如下,按列来看,分别是: 图像名称 置信度 xmin ymin xmax ymax

第二种、一、生成测试集的测试图片
针对测试集,批量测试图片并将测试的图片显示结果保存在自定义的文件夹下
1)替换detector.c
用下面的代码替换detector.c文件(example文件夹下)的void test_detector函数(此处有三处需要改成自己的路径)
void test_detector(char *datacfg, char *cfgfile, char *weightfile, char *filename, float thresh, float hier_thresh, char *outfile, int fullscreen)
{
    list *options = read_data_cfg(datacfg);
    char *name_list = option_find_str(options, "names", "data/names.list");
    char **names = get_labels(name_list);

    image **alphabet = load_alphabet();
    network *net = load_network(cfgfile, weightfile, 0);
    set_batch_network(net, 1);
    srand(2222222);
    double time;
    char buff[256];
    char *input = buff;
    float nms=.45;
    int i=0;
    while(1){
        if(filename){
            strncpy(input, filename, 256);
            image im = load_image_color(input,0,0);
            image sized = letterbox_image(im, net->w, net->h);
        //image sized = resize_image(im, net->w, net->h);
        //image sized2 = resize_max(im, net->w);
        //image sized = crop_image(sized2, -((net->w - sized2.w)/2), -((net->h - sized2.h)/2), net->w, net->h);
        //resize_network(net, sized.w, sized.h);
            layer l = net->layers[net->n-1];


            float *X = sized.data;
            time=what_time_is_it_now();
            network_predict(net, X);
            printf("%s: Predicted in %f seconds.\n", input, what_time_is_it_now()-time);
            int nboxes = 0;
            detection *dets = get_network_boxes(net, im.w, im.h, thresh, hier_thresh, 0, 1, &nboxes);
            //printf("%d\n", nboxes);
            //if (nms) do_nms_obj(boxes, probs, l.w*l.h*l.n, l.classes, nms);
            if (nms) do_nms_sort(dets, nboxes, l.classes, nms);
                draw_detections(im, dets, nboxes, thresh, names, alphabet, l.classes);
                free_detections(dets, nboxes);
            if(outfile)
             {
                save_image(im, outfile);
             }
            else{
                save_image(im, "predictions");
#ifdef OPENCV
                cvNamedWindow("predictions", CV_WINDOW_NORMAL);
                if(fullscreen){
                cvSetWindowProperty("predictions", CV_WND_PROP_FULLSCREEN, CV_WINDOW_FULLSCREEN);
                }
                show_image(im, "predictions");
                cvWaitKey(0);
                cvDestroyAllWindows();
#endif
            }
            free_image(im);
            free_image(sized);
            if (filename) break;
         }
        else {
            printf("Enter Image Path: ");
            fflush(stdout);
            input = fgets(input, 256, stdin);
            if(!input) return;
            strtok(input, "\n");

            list *plist = get_paths(input);
            char **paths = (char **)list_to_array(plist);
             printf("Start Testing!\n");
            int m = plist->size;
            if(access("/home/FENGsl/darknet/data/out",0)==-1)//"/home/FENGsl/darknet/data"修改成自己的路径
            {
              if (mkdir("/home/FENGsl/darknet/data/out",0777))//"/home/FENGsl/darknet/data"修改成自己的路径
               {
                 printf("creat file bag failed!!!");
               }
            }
            for(i = 0; i < m; ++i){
             char *path = paths[i];
             image im = load_image_color(path,0,0);
             image sized = letterbox_image(im, net->w, net->h);
        //image sized = resize_image(im, net->w, net->h);
        //image sized2 = resize_max(im, net->w);
        //image sized = crop_image(sized2, -((net->w - sized2.w)/2), -((net->h - sized2.h)/2), net->w, net->h);
        //resize_network(net, sized.w, sized.h);
        layer l = net->layers[net->n-1];


        float *X = sized.data;
        time=what_time_is_it_now();
        network_predict(net, X);
        printf("Try Very Hard:");
        printf("%s: Predicted in %f seconds.\n", path, what_time_is_it_now()-time);
        int nboxes = 0;
        detection *dets = get_network_boxes(net, im.w, im.h, thresh, hier_thresh, 0, 1, &nboxes);
        //printf("%d\n", nboxes);
        //if (nms) do_nms_obj(boxes, probs, l.w*l.h*l.n, l.classes, nms);
        if (nms) do_nms_sort(dets, nboxes, l.classes, nms);
        draw_detections(im, dets, nboxes, thresh, names, alphabet, l.classes);
        free_detections(dets, nboxes);
        if(outfile){
            save_image(im, outfile);
        }
        else{

             char b[2048];
            sprintf(b,"/home/FENGsl/darknet/data/out/%s",GetFilename(path));//"/home/FENGsl/darknet/data"修改成自己的路径

            save_image(im, b);
            printf("save %s successfully!\n",GetFilename(path));
#ifdef OPENCV
            cvNamedWindow("predictions", CV_WINDOW_NORMAL);
            if(fullscreen){
                cvSetWindowProperty("predictions", CV_WND_PROP_FULLSCREEN, CV_WINDOW_FULLSCREEN);
            }
            show_image(im, "predictions");
            cvWaitKey(0);
            cvDestroyAllWindows();
#endif
        }

        free_image(im);
        free_image(sized);
        if (filename) break;
        }
      }
    }
}
2)修改detector.c
在detector.c文件的最前面加上*GetFilename(char *p)函数(根据自己的情况更改注释处的内容)
#include "darknet.h"

static int coco_ids[] = {1,2,3,4,5,6,7,8,9,10,11,13,14,15,16,17,18,19,20,21,22,23,24,25,27,28,31,32,33,34,35,36,37,38,39,40,41,42,43,44,46,47,48,49,50,51,52,53,54,55,56,57,58,59,60,61,62,63,64,65,67,70,72,73,74,75,76,77,78,79,80,81,82,84,85,86,87,88,89,90};

char *GetFilename(char *p)
{
    static char name[20]={""};
    char *q = strrchr(p,'/') + 1;
    strncpy(name,q,7);//注意后面的7,如果你的测试集的图片的名字字符(不包括后缀)是其他长度,请改为你需要的长度(官方的默认的长度是6)
    return name;
}
3)make
在darknet下重新进行make一下(图为别人的)
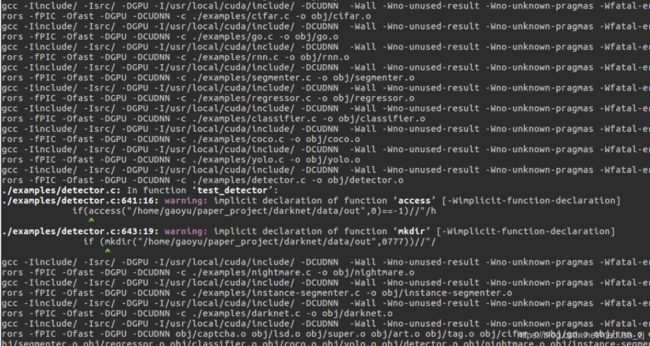
注:在make的时候可能会出现如下错误
#ifdef OPENCV cvNamedWindow("predictions", CV_WINDOW_NORMAL); 提示找不到CV_WINDOW_NORMAL的定义? 报错: error: ‘CV_WINDOW_NORMAL’ undeclared (first use in this function)
解决方法:
找到darknet下的Makefile文件将OPENCV=0
4)开始批量测试
在此终端下输入批量测试的命令
./darknet detector test cfg/voc.data cfg/yolov3-voc.cfg backup/yolov3-voc_50000.weights
接下来会让输入:Enter Image Path:
后面输入你的txt文件路径(你准备好的所有测试图片的路径全部存放在一个txt文件里),你可以复制voc.data文件里的valid后面的路径,就可以了。

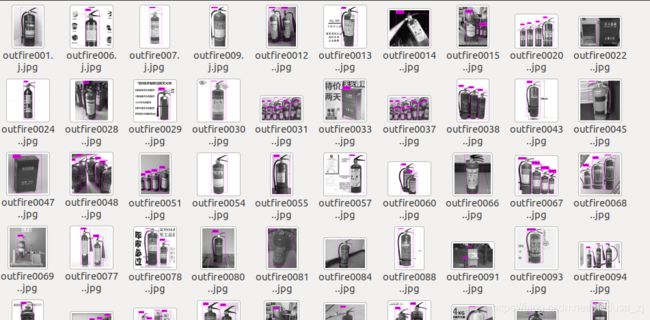
在darknet下的data中生成out文件夹,里面存放的是批量测试后的图片标注结果
AP,mAP计算
一、准备
下载检测用脚本文件 reval_voc_py.py和voc_eval_py.py
下载链接
二、生成pkl
注意要在 /darknet/voc/VOCdevkit/VOC2022/Annotations文件夹例放对应的xml文件
同时要准备上面批量测试的的第一种,生成测试集的txt文件。
使用reval_voc_py.py计算出mAP值并且生成pkl文件,命令如下:
python reval_voc_py3.py --voc_dir <voc文件路径> --year <年份> --image_set <验证集文件名> --classes <类名文件路径> <输出文件夹名>
reval_voc_py3.py表示当前运行的脚本文件名,python3的话就用这个,python2的话用reval_voc.py。
voc文件路径就是当时训练用的VOC数据集的路径,比如windows下 d:\darknet\scripts\VOCdevkit,linux就是 \home\xxx\darknet\scripts\VOCdevkit,这里只是打个比方,读者请替换成自己需要的路径
年份就是VOC数据集里VOC文件名里的时间,比如2007、2012这样的。
验证集文件名一般是VOCdevkit\VOC2017\ImageSets\Main中的文件中txt文件名,比如train.txt,把需要测试的图片名全部塞进去就可以了,如果没有的话自行创建(不过没有的话怎么训练的呢)。注意:这里只需要填文件名,txt后缀都不需要的。
类名文件路径就是voc.names文件的路径,在voc.data文件里面是有的,第4行names那里。
输出文件夹名就自己随便写了,比如我这里写的testForCsdn,我的命令如下。
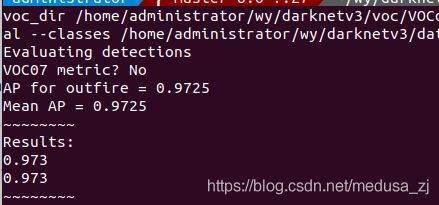
python reval_voc.py --voc_dir /home/administrator/wy/darknetv3/voc/VOCdevkit --year 2021 --image_set val --classes /home/administrator/wy/darknetv3/data/voc.names testForCsdn
这时会在脚本当前目录生成一个存放了pkl文件的文件夹,名字就是刚才输入的输出文件夹名。(这里的名字不需要和我的一样,如果你有多个类的话,就会生成多个文件,文件名就是你的类名)
运行后如下:
注意如果遇到以下问题:
需要删除/darknet/voc/VOCdevkit/annotations_cache文件夹
三、绘制PR曲线
在得到pkl文件目录里直接创建一个python文件,比如PR_draw.py,内容如下,记得把第三行里的参数修改一下。
import _pickle as cPickle
import matplotlib.pyplot as plt
fr = open('apple_pr.pkl','rb')#这里open中第一个参数需要修改成自己生产的pkl文件
inf = cPickle.load(fr)
fr.close()

x=inf['rec']
y=inf['prec']
plt.figure()
plt.xlabel('recall')
plt.ylabel('precision')
plt.title('PR cruve')
plt.plot(x,y)
plt.show()

print('AP:',inf['ap'])

