数理统计——描述统计与Python实现
文章目录
- 前言
- 一、描述性统计是什么?
-
- 1.统计量
- 2.变量的类型
- 二、各统计量与python实操
-
- 1.频数与频率
- 2.集中趋势
- 3.四分位值
- 4.离散趋势
- 5.分布形态(和偏度相关)
- 5.分布形态(和峰度相关)
- 作业:
前言
本节知识要点与目标:
1、熟知描述性统计常用的统计量
2、清晰认知各统计量的含义和应用
3、能用Python实现,应用于数据分析中
一、描述性统计是什么?
从总体数据中提取变量的主要信息(总和,均值等)。从总体的层面上对数据进行统计描述,在统计过程中经常会配合绘制一些相关统计图来辅助。
1.统计量
统计量,即所要提取统计的信息,包括下面这些:
1、频数与频率
2、集中趋势分析(均值、中位数、众数)
3、离散程度分析(方差标准差、极差)
4、分布形状(偏度、峰度)
2.变量的类型
1、类别变量
有序(等级变量 )
无序(名义变量)
2、数值变量
连续变量
离散变量
二、各统计量与python实操
1.频数与频率
频数与频率适用于类别变量,频数是指变量出现次数的统计,频率是指每个类别变量频数与总次数的比值,采用百分比表示。
以鸢尾花的数据集为例:计算每种鸢尾花类别的频数和频率。
1、在使用数据之前需要对数据有个概览,知道数据的组成和结构。
#导入相关的库
import numpy as np
import pandas as pd
import matplotlib.pyplot as plt
import seaborn as sns
from sklearn.datasets import load_iris
import warnings

#设置seaborn绘图的样式
sns.set(style="darkgrid")
plt.rcParams["font.family"]="SiHei"
plt.rcParams["axes.unicode_minus"]=False

#忽略警告信息
warnings.filterwarnings("ignore")

#加载鸢尾花信息:
#iris.data代表鸢尾花数据集;iris.target代表每朵鸢尾花对应的类别,取值有0,1,2三种;
#iris.feature_names代表的是特征列的名称;iris.target_names代表的是鸢尾花类别的名称
iris=load_iris()
#display(iris)
display(iris.data[:10],iris.target[:10])
display(iris.feature_names,iris.target_names)


输出:
array([[5.1, 3.5, 1.4, 0.2],
       [4.9, 3. , 1.4, 0.2],
       [4.7, 3.2, 1.3, 0.2],
       [4.6, 3.1, 1.5, 0.2],
       [5. , 3.6, 1.4, 0.2],
       [5.4, 3.9, 1.7, 0.4],
       [4.6, 3.4, 1.4, 0.3],
       [5. , 3.4, 1.5, 0.2],
       [4.4, 2.9, 1.4, 0.2],
       [4.9, 3.1, 1.5, 0.1]])
array([0, 0, 0, 0, 0, 0, 0, 0, 0, 0])
['sepal length (cm)',
 'sepal width (cm)',
 'petal length (cm)',
 'petal width (cm)']
array(['setosa', 'versicolor', 'virginica'], dtype=')
2、接着可以对数据进行组合,转换等
#将鸢尾花与对应的类型合并在一起,组合成完整的记录
data=np.concatenate([iris.data,iris.target.reshape(-1,1)],axis=1)
data=pd.DataFrame(data,columns=["sepal_length","sepal_width","petal_length","petal_width","type"])
data.sample(10)

输出:
sepal_length sepal_width petal_length petal_width type
34	4.9	3.1	1.5	0.2	0.0
46	5.1	3.8	1.6	0.2	0.0
71	6.1	2.8	4.0	1.3	1.0
108	6.7	2.5	5.8	1.8	2.0
30	4.8	3.1	1.6	0.2	0.0
59	5.2	2.7	3.9	1.4	1.0
125	7.2	3.2	6.0	1.8	2.0
17	5.1	3.5	1.4	0.3	0.0
144	6.7	3.3	5.7	2.5	2.0
23	5.1	3.3	1.7	0.5	0.0
3、找出要分析的数据是什么?
在本数据集中,我们以每种鸢尾花的类型(type)为例子,计算鸢尾花每个类别的频数和频率。
#计算频数
frequency=data["type"].value_counts()
display(frequency)
#计算每个类别出现的频率,通常使用百分比表示
percentage=frequency*100/len(data)
display(percentage)

输出:

类型  频数
2.0    50
1.0    50
0.0    50

类型    频率
2.0    33.333333
1.0    33.333333
0.0    33.333333
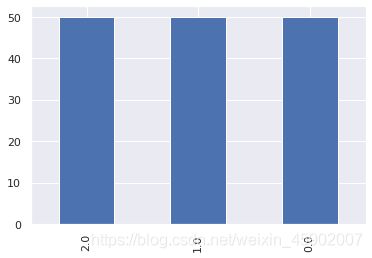
4、可视化:以直观的条形统计图(bar)来展现类别变量的分布情况
#可视化
frequency.plot(kind="bar")
2.集中趋势
即平均值、中位数、众数,三者概念不再细述。
说明:
\数值变量通常使用均值或中值表示集中趋势;
\类别变量通常使用众数表示集中趋势;
\正态分布下,三者相同,偏态分布,有所差异;
\均值使用所有值进行计算,容易受到极端值的影响;
\中、众不受极端值影响,相对稳定;
\众数在一组数据中可能不唯一;
三者关系如下:

以花萼(sepal_length)的长度为例,计算其均值、中位数、众数:
#均值
mean=data["sepal_length"].mean()
#计算中值:
median=data["sepal_length"].median()
#计算众数:
mode=data["sepal_length"].mode()
print(mean,median,mode)

输出:
5.843333333333335
5.8 0
5.0
#也可以使用scipy中的stats模块来求一组数的众数:
from scipy import stats
stats.mode(data["sepal_length"]).mode
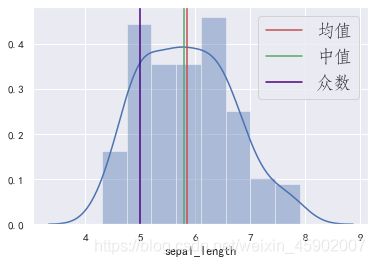
三者几乎相同,我们猜想数据的分布应该接近正态分布,所以绘制出数据的直方图和三者的垂直线:
# 绘制数据的分布(直方图 + 密度图)。
sns.distplot(data["sepal_length"])
from matplotlib import font_manager
my_font=font_manager.FontProperties(fname="C:/Windows/Fonts/STFANGSO.TTF",size=18)

# 绘制垂直线。
plt.axvline(mean, ls="-", color="r", label="均值")
plt.axvline(median, ls="-", color="g", label="中值")
plt.axvline(mode, ls="-", color="indigo", label="众数")
plt.legend(prop=my_font,loc="upper right")
3.四分位值
分位数,通过n-1个分位将数据分为n个区间,使得每个区间的数值个数相等其中n为分位数的数量。常用四分位与百分位。
在Python中,四分位的计算方式如下:
#如果计算结果index是整数,那么四分位值就是数组中索引为index的元素
#如果不是整数,则四分位值介于ceil(index)与floor(index)之间。
index为整数,计算四分位值:
#1、先计算四分位的位置;
x=np.arange(10,19)
n=len(x)
q1_index=(n-1)*0.25
q2_index=(n-1)*0.5
q3_index=(n-1)*0.75
print(q1_index,q2_index,q3_index)

#2、根据四分位值计算四分位值
#将上面输出结果转化为整数
index=np.array([q1_index,q2_index,q3_index]).astype(np.int32)
print(x[index])

#绘图
from matplotlib import font_manager
my_font=font_manager.FontProperties(fname="C:/Windows/Fonts/STFANGSO.TTF",size=18)

plt.figure(figsize=(15,4))
plt.xticks(x)
plt.plot(x,np.zeros(len(x)),ls="",marker="D",ms=15,label="元素值")
plt.plot(x[index],np.zeros(len(index)),ls="",marker="X",ms=15,label="四分位值")
plt.legend(prop=my_font,loc="upper right")

输出:
2.0 4.0 6.0
[12 14 16]
图形:

如果index不是整数,则四分位值介于ceil(index)与floor(index)之间。
x=np.arange(10,20)
n=len(x)
q1_index=(n-1)*0.25
q2_index=(n-1)*0.5
q3_index=(n-1)*0.75
print(q1_index,q2_index,q3_index)

#使用该值邻近的两个整数来计算四分位值:
index=np.array([q1_index,q2_index,q3_index])
#计算左边元素的值
left=np.floor(index).astype(np.int32)
#计算右边元素的值
right=np.ceil(index).astype(np.int32)
#获取index的小数部分与整数部分
weight,_=np.modf(index)
#根据左右两百年的整数,加权计算四分位的值,权重与距离成反比,2.25=2*(1-权重)+3*权重=2*0.75+3*0.25=2.25
q=x[left]*(1-weight)+x[right]*weight
print(q)

#绘图:
plt.figure(figsize=(15,4))
plt.xticks(x)
plt.plot(x,np.zeros(len(x)),ls="",marker="D",ms=15,label="元素值")
plt.plot(q,np.zeros(len(q)),ls="",marker="X",ms=15,label="四分位值")
for v in q:
    plt.text(v,0.01,s=v,fontsize=15)
plt.legend(prop=my_font,loc="upper right")

输出:
2.25 4.5 6.75
[12.25 14.5  16.75]

#Python提供了计算四分位数的方法:
1、使用numpy方法:
x=[1,3,10,15,18,20,23,40]
print(np.quantile(x,q=[0.25,0.5,0.75]))#q的取值范围是【0,1】
print(np.percentile(x,q=[25,50,75]))#这个方法计算的q取值范围是【0,100】

输出:
[ 8.25 16.5  20.75]
[ 8.25 16.5  20.75]
2、使用pandas方法:
#使用pandas计算
x=[1,3,10,15,18,20,23,40]
s=pd.Series(x)
print(s.describe())

输出:
count     8.000000
mean     16.250000
std      12.395276
min       1.000000
25%       8.250000
50%      16.500000
75%      20.750000
max      40.000000
dtype: float64
问:怎样在程序中获取四分之一的值:建议使用下面这两个。
s.describe()iloc[4]
s.describe().loc[25%]
describe方法会统计各个四分位的值,也可以通过percentiles来自定义需要统计的百分位,比如0.8。
s.describe(percentiles=[0.25,0.8])
count     8.000000
mean     16.250000
std      12.395276
min       1.000000
25%       8.250000
50%      16.500000
80%      21.800000
max      40.000000
4.离散趋势
要了解极差、方差、和标准差的计算方式,常用场景。
例子:计算一下花萼长度的极差、方差和标准差
sub=data["sepal_length"].max()-data["sepal_length"].min()
var=data["sepal_length"].var()
std=data["sepal_length"].std()
print(sub,var,std)

输出:3.6000000000000005 0.6856935123042505 0.8280661279778629
顺便绘图看一下花瓣长度和宽度的一个方差对比情况:
#在鸢尾花的数据集中,花瓣长度的方差较大,花瓣宽度的方差较小,通过绘图对比一下。
plt.figure(figsize=(15,4))
plt.ylim(-0.5,1.5)
plt.plot(data["petal_length"],np.zeros(len(data)),ls="",marker="o",ms=10,color="g",label="花瓣长度")
plt.plot(data["petal_width"],np.zeros(len(data)),ls="",marker="o",ms=10,color="r",label="花瓣宽度")
plt.axvline(data["petal_length"].mean(),ls="--",color="g",label="花瓣长度均值")
plt.axvline(data["petal_width"].mean(),ls="--",color="r",label="花瓣宽度均值")
plt.legend(prop=my_font,loc="upper right")
5.分布形态(和偏度相关)
左偏态分布:偏度小于0
右偏态分布:偏度大于0
对称分布:偏度为0,多为正态分布。
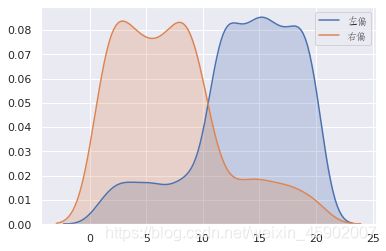
来构造偏态并可视化出结果:
#构造左偏分布
t1=np.random.randint(1,11,size=100)
t2=np.random.randint(11,21,size=500)
t3=np.concatenate([t1,t2])
left_skew=pd.Series(t3)
print(left_skew.skew())

#构造右偏分布
t1=np.random.randint(1,11,size=500)
t2=np.random.randint(11,21,size=100)
t3=np.concatenate([t1,t2])
right_skew=pd.Series(t3)
print(right_skew.skew())

#绘制偏态图形
from matplotlib import font_manager
my_font=font_manager.FontProperties(fname="C:/Windows/Fonts/STFANGSO.TTF",size=10)

sns.kdeplot(left_skew,shade=True,label="左偏")
sns.kdeplot(right_skew,shade=True,label="右偏")
plt.legend(prop=my_font,loc="upper right")

输出:偏度值
-0.8635916710076699
0.8576435912059222
5.分布形态(和峰度相关)
峰度:描述总体中所有取值分布形态的陡缓程度,可以理解为分布的高矮程度。其对比对象是标准的正态分布。
from matplotlib import font_manager
my_font=font_manager.FontProperties(fname="C:/Windows/Fonts/STFANGSO.TTF",size=10)
#峰度与标准正态分布
standard_normal = pd.Series(np.random.normal(0, 1, size=10000))
print("标准正态分布峰度:", standard_normal.kurt(), "标准差:", standard_normal.std())
print("花萼宽度峰度:", data["sepal_width"].kurt(), "标准差:", data["sepal_width"].std())
print("花瓣长度峰度:", data["petal_length"].kurt(), "标准差:", data["petal_length"].std())
sns.kdeplot(standard_normal, label="标准正态分布")
sns.kdeplot(data["sepal_width"], label="花萼宽度")
sns.kdeplot(data["petal_length"], label="花瓣长度")
plt.legend(prop=my_font,loc="upper right")

输出:
标准正态分布峰度: -0.013203603700220334 标准差: 0.9935726216550377
花萼宽度峰度: 0.2282490424681929 标准差: 0.435866284936698
花瓣长度峰度: -1.4021034155217518 标准差: 1.7652982332594667
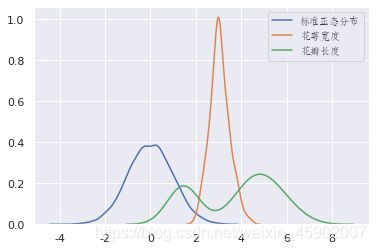
可以看到花萼宽度的峰度大于0,高于正态分布。数据在分布上比标准正态分布密集,方差较小。
作业:
1、求解鸢尾花滑板长度的1/10与7/10分位值。
import numpy as np
import pandas as pd
import matplotlib as mpl
import matplotlib.pyplot as plt
import seaborn as sns
from sklearn.datasets import load_iris
import warnings
%matplotlib inline
sns.set(style="darkgrid")
mpl.rcParams["font.family"] = "SimHei"
mpl.rcParams["axes.unicode_minus"] = False
warnings.filterwarnings("ignore")
# 加载鸢尾花数据集。
iris = load_iris()
# 将鸢尾花数据与对应的类型合并,组合成完整的记录。
data = np.concatenate([iris.data, iris.target.reshape(-1, 1)], axis=1)
data = pd.DataFrame(data,
columns=["sepal_length", "sepal_width", "petal_length", "petal_width", "type"])
print(np.quantile(data['petal_length'].tolist(), [0.1,0.7]))
#结果值   [1.4 5. ]
Series的mode()方法与scipy库中stats.mode()方法都可以求数组的众数,二者等价吗?
#使用scipy中的stats模块来求一组数的众数:
from scipy import stats
stats.mode(data["petal_length"]).mode

#计算众数:
mode=data["petal_length"].mode()
print(mode)

输出:
1.4
1.4 1.5
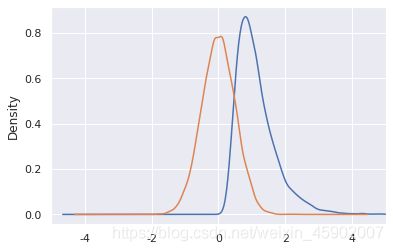
如果一个分布取对数后为正态分布,则该分布称为对数正态分布。绘制一个对数正态分布的图像:
#构造一个对数分布
scale=0.5
x=np.random.normal(0,scale,size=10000)
y=pd.Series(np.exp(x))
y.plot(kind="kde")
np.log(y).plot(kind="kde")
plt.xlim(-5,5)
