【Python人工智能】Python全栈体系(十八)
人工智能
第六章 支持向量机(分类模型)
一、基本概念
1. 什么是支持向量机
- “支持向量机”(SVM)是一种有监督的机器学习算法,可用于分类任务或回归任务。主要使用于分类问题。在这个算法中,我们将每个数据项绘制为n维空间中的一个点(其中n是你拥有的特征的数量),每个特征的值是特定坐标的值。然后,我们通过找到最优分类超平面来执行分类任务。
- 支持向量机(Support Vector Machines)是一种二分类模型,在机器学习、计算机视觉、数据挖掘中广泛应用,主要用于解决数据分类问题,它的目的是寻找一个超平面来对样本进行分割,分割的原则是间隔最大化(即数据集的边缘点到分界线的距离d最大,如下图),最终转化为一个凸二次规划问题来求解。通常SVM用于二元分类问题,对于多元分类可将其分解为多个二元分类问题,再进行分类。所谓“支持向量”,就是下图中虚线穿过的边缘点。支持向量机就对应着能将数据正确划分并且间隔最大的直线(下图中红色直线)。

2. 最优分类边界
- 什么才是最优分类边界?什么条件下的分类边界为最优边界呢?
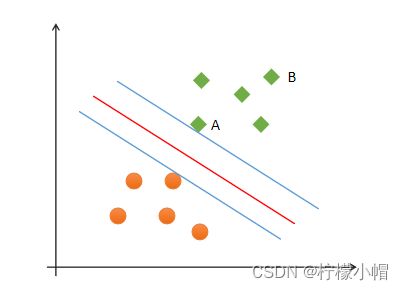
- 如图中的A,B两个样本点,B点被预测为正类的确信度要大于A点,所以SVM的目标是寻找一个超平面,使得离超平面较近的异类点之间能有更大的间隔,即不必考虑所有样本点,只需让求得的超平面使得离它近的点间隔最大。超平面可以用如下线性方程来描述:
w T x + b = 0 w^T x + b = 0 wTx+b=0
其中, x = ( x 1 ; x 2 ; . . . ; x n ) x=(x_1;x_2;...;x_n) x=(x1;x2;...;xn), w = ( w 1 ; w 2 ; . . . ; w n ) w=(w_1;w_2;...;w_n) w=(w1;w2;...;wn), b b b为偏置项. 可以从数学上证明,支持向量到超平面距离为:
γ = 1 ∣ ∣ w ∣ ∣ \gamma = \frac{1}{||w||} γ=∣∣w∣∣1
为了使距离最大,只需最小化 ∣ ∣ w ∣ ∣ ||w|| ∣∣w∣∣即可.
3. SVM最优边界要求
- SVM寻找最优边界时,需满足以下几个要求:
(1)正确性:对大部分样本都可以正确划分类别;
(2)安全性:支持向量,即离分类边界最近的样本之间的距离最远;
(3)公平性:支持向量与分类边界的距离相等;
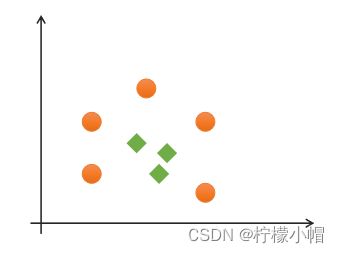
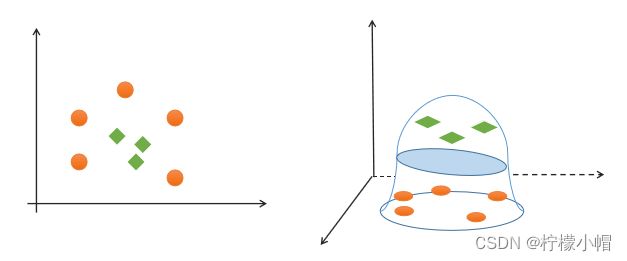
(4)简单性:采用线性方程(直线、平面)表示分类边界,也称分割超平面。如果在原始维度中无法做线性划分,那么就通过升维变换,在更高维度空间寻求线性分割超平面. 从低纬度空间到高纬度空间的变换通过核函数进行。
4. 线性可分与线性不可分
① 线性可分
如果一组样本能使用一个线性函数将样本正确分类,称这些数据样本是线性可分的。那么什么是线性函数呢?在二维空间中就是一条直线,在三维空间中就是一个平面,以此类推,如果不考虑空间维数,这样的线性函数统称为超平面。
② 线性不可分
如果一组样本,无法找到一个线性函数将样本正确分类,则称这些样本线性不可分。以下是一个一维线性不可分的示例:

- 那么如何实现升维?这就需要用到核函数。
二、支持向量机的原理
- “支持向量机”任务的核心是:寻求最优分类边界。最优分类边界应有如下特性:
- 正确:对大部分样本可以正确地划分类别。
- 泛化:最大化支持向量间距。
- 公平:与支持向量等距。
- 简单:线性,直线或平面,超平面。
三、支持向量机的核函数
- SVM 通过名为核函数的特征变换,可以增加新的特征,使得低维度空间中的线性不可分问题在高维度空间变得线性可分。
- 如果低维空间存在K(x,y),x,y∈Χ,使得K(x,y)=ϕ(x)·ϕ(y),则称K(x,y)为核函数,其中ϕ(x)·ϕ(y)为x,y映射到特征空间上的内积,ϕ(x)为X→H的映射函数。
- 以下是几种常用的核函数。
1. 线性核函数
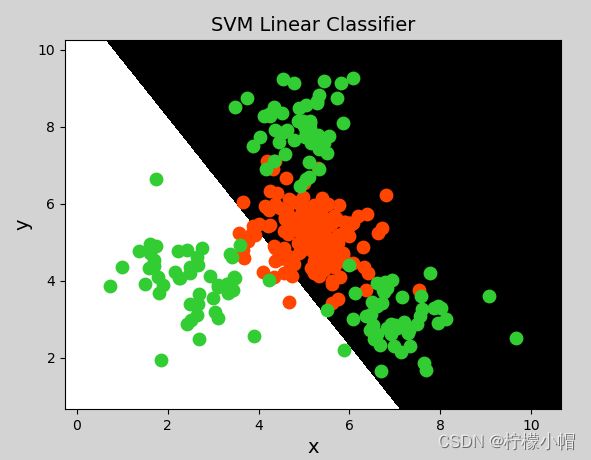
- 线性核函数:linear,不通过核函数进行维度提升,仅在原始维度空间中寻求线性分类边界,主要用于线性可分问题。
# 支持向量机示例
import numpy as np
import sklearn.model_selection as ms
import sklearn.svm as svm
import sklearn.metrics as sm
import matplotlib.pyplot as mp

x, y = [], []
with open("../data/multiple2.txt", "r") as f:
    for line in f.readlines():
        data = [float(substr) for substr in line.split(",")]
        x.append(data[:-1])  # 输入
        y.append(data[-1])  # 输出

# 列表转数组
x = np.array(x)
y = np.array(y, dtype=int)

# 线性核函数支持向量机分类器
model = svm.SVC(kernel="linear")  # 线性核函数
# model = svm.SVC(kernel="poly", degree=3)  # 多项式核函数
# print("gamma:", model.gamma)
# 径向基核函数支持向量机分类器
# model = svm.SVC(kernel="rbf",
#                 gamma=0.01,  # 概率密度标准差
#                 C=200)  # 概率强度
model.fit(x, y)

# 计算图形边界
l, r, h = x[:, 0].min() - 1, x[:, 0].max() + 1, 0.005
b, t, v = x[:, 1].min() - 1, x[:, 1].max() + 1, 0.005

# 生成网格矩阵
grid_x = np.meshgrid(np.arange(l, r, h), np.arange(b, t, v))
flat_x = np.c_[grid_x[0].ravel(), grid_x[1].ravel()]  # 合并
flat_y = model.predict(flat_x)  # 根据网格矩阵预测分类
grid_y = flat_y.reshape(grid_x[0].shape)  # 还原形状

mp.figure("SVM Classifier", facecolor="lightgray")
mp.title("SVM Classifier", fontsize=14)

mp.xlabel("x", fontsize=14)
mp.ylabel("y", fontsize=14)
mp.tick_params(labelsize=10)
mp.pcolormesh(grid_x[0], grid_x[1], grid_y, cmap="gray")

C0, C1 = (y == 0), (y == 1)
mp.scatter(x[C0][:, 0], x[C0][:, 1], c="orangered", s=80)
mp.scatter(x[C1][:, 0], x[C1][:, 1], c="limegreen", s=80)
mp.show()
2. 多项式核函数
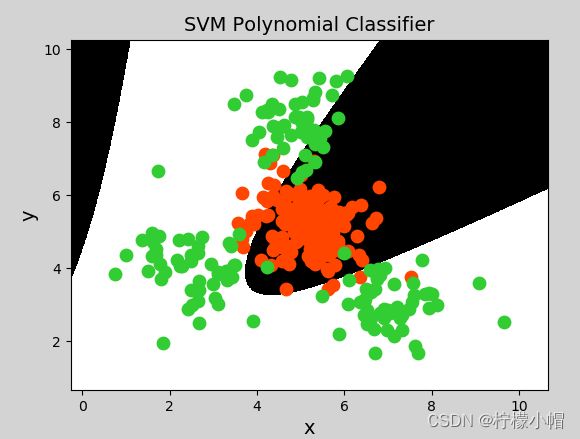
- 多项式核函数:poly,通过多项式函数增加原始样本特征的高次方幂。
- 多项式核函数(Polynomial Kernel)用增加高次项特征的方法做升维变换,当多项式阶数高时复杂度会很高,其表达式为:
K ( x , y ) = ( α x T ⋅ y + c ) d K(x,y)=(αx^T·y+c)d K(x,y)=(αxT⋅y+c)d
y = x 1 + x 2 y = x 1 2 + 2 x 1 x 2 + x 2 2 y = x 1 3 + 3 x 1 2 x 2 + 3 x 1 x 2 2 + x 2 3 y = x_1 + x_2\\ y = x_1^2 + 2x_1x_2+x_2^2\\ y=x_1^3 + 3x_1^2x_2 + 3x_1x_2^2 + x_2^3 y=x1+x2y=x12+2x1x2+x22y=x13+3x12x2+3x1x22+x23
- 其中,α表示调节参数,d表示最高次项次数,c为可选常数。
- 示例代码(将上一示例中创建支持向量机模型改为一下代码即可):
model = svm.SVC(kernel="poly", degree=3) # 多项式核函数
3. 径向基核函数
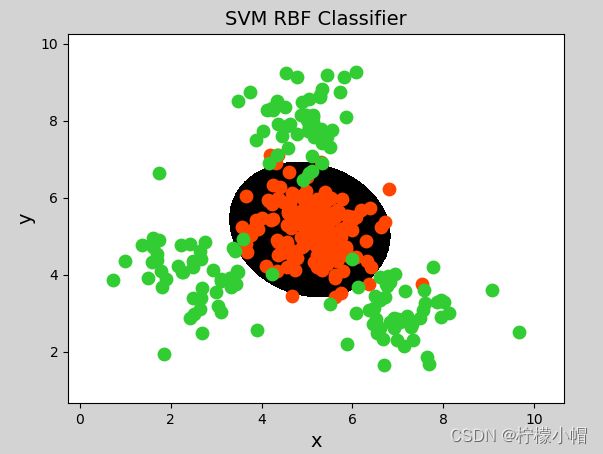
- 径向基核函数:rbf,通过高斯分布函数增加原始样本特征的分布概率。
- 径向基核函数(Radial Basis Function Kernel)具有很强的灵活性,应用很广泛。与多项式核函数相比,它的参数少,因此大多数情况下,都有比较好的性能。在不确定用哪种核函数时,可优先验证高斯核函数。由于类似于高斯函数,所以也称其为高斯核函数。
- 示例代码(将上一示例中分类器模型改为如下代码即可):
# 径向基核函数支持向量机分类器
model = svm.SVC(kernel="rbf",
                gamma=0.01, # 概率密度标准差
                C=600)  # 概率强度,该值越大对错误分类的容忍度越小,分类精度越高,但泛化能力越差;该值越小,对错误分类容忍度越大,但泛化能力强
4. 总结
- SVM 线性核函数的 sklearn 实现如下:
model = svm.SVC(kernel='linear')
model.fit(train_x, train_y)
- SVM 多项式核函数的 sklearn 实现如下:
# 基于线性核函数的支持向量机分类器
model = svm.SVC(kernel='poly', degree=3)
model.fit(train_x, train_y)
- SVM 径向基核函数的 sklearn 实现如下:
# 基于径向基核函数的支持向量机分类器
# C:正则强度
# gamma:'rbf','poly'和'sigmoid'的内核函数。伽马值越高,则会精确拟合训练数据集,有可能导致过拟合问题。
model = svm.SVC(kernel='rbf', C=600, gamma=0.01)
model.fit(train_x, train_y)
(1)支持向量机是二分类模型
(2)支持向量机通过寻找最优线性模型作为分类边界
(3)边界要求:正确性、公平性、安全性、简单性
(4)可以通过核函数将线性不可分转换为线性可分问题,核函数包括:线性核函数、多项式核函数、径向基核函数
(5)支持向量机适合少量样本的分类
四、网格搜索
- 获取一个最优超参数的方式可以绘制验证曲线,但是验证曲线只能每次获取一个最优超参数。如果多个超参数有很多排列组合的话,就可以使用网格搜索寻求最优超参数组合。
- 针对超参数组合列表中的每一个超参数组合,实例化给定的模型,做cv次交叉验证,将其中平均f1得分最高的超参数组合作为最佳选择,实例化模型对象并返回。
- 网格搜索相关API:
import sklearn.model_selection as ms
params =
[{'kernel':['linear'], 'C':[1, 10, 100, 1000]},
 {'kernel':['poly'], 'C':[1], 'degree':[2, 3]},
 {'kernel':['rbf'], 'C':[1,10,100], 'gamma':[1, 0.1, 0.01]}]
model = ms.GridSearchCV(模型, params, cv=交叉验证次数)
model.fit(输入集,输出集)
# 获取网格搜索每个参数组合
model.cv_results_['params']
# 获取网格搜索每个参数组合所对应的平均测试分值
model.cv_results_['mean_test_score']
# 获取最好的参数
model.best_params_
model.best_score_
model.best_estimator_
五、案例:支持向量机实现
import numpy as np
import matplotlib.pyplot as plt
import pandas as pd

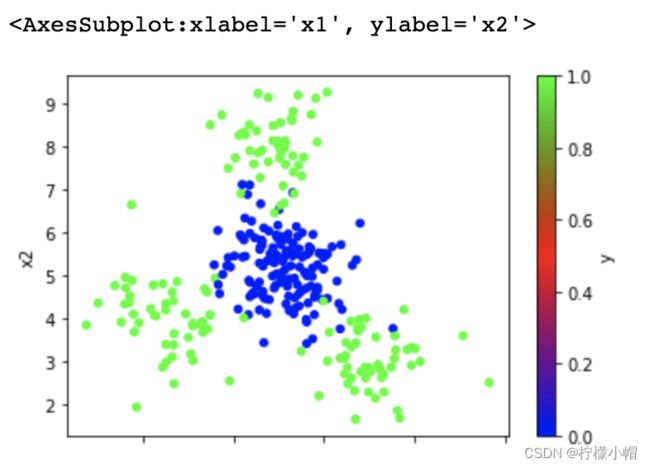
data = pd.read_csv('multiple2.txt', header=None, names=['x1', 'x2', 'y'])
data.plot.scatter(x='x1', y='x2', c='y', cmap='brg')
import sklearn.model_selection as ms
import sklearn.svm as svm
import sklearn.metrics as sm
# 整理数据集,拆分测试集训练集
x, y = data.iloc[:, :-1], data['y']
train_x, test_x, train_y, test_y = ms.train_test_split(x, y, test_size=0.25, random_state=7)
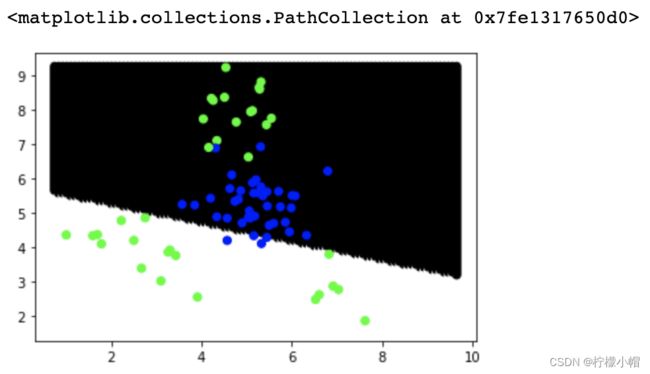
model = svm.SVC(kernel='linear')
model.fit(train_x, train_y)
pred_test_y = model.predict(test_x)
print(sm.classification_report(test_y, pred_test_y))
"""
              precision    recall  f1-score   support

           0       0.69      0.90      0.78        40
           1       0.83      0.54      0.66        35

    accuracy                           0.73        75
   macro avg       0.76      0.72      0.72        75
weighted avg       0.75      0.73      0.72        75
"""
data.head()
"""
	x1		x2		y
0	5.35	4.48	0
1	6.72	5.37	0
2	3.57	5.25	0
3	4.77	7.65	1
4	2.25	4.07	1
"""
# 暴力绘制分类边界线
# 从x的min-max,拆出100个x坐标
# 从y的min-max,拆出100个y坐标
# 一共组成10000个坐标点,预测每个坐标点的类别标签,绘制散点
xs = np.linspace(data['x1'].min(), data['x1'].max(), 100)
ys = np.linspace(data['x2'].min(), data['x2'].max(), 100)
points = []
for x in xs:
    for y in ys:
        points.append([x, y])
points = np.array(points)
# 预测每个坐标点的类别标签 绘制散点
point_labels = model.predict(points)
plt.scatter(points[:,0], points[:,1], c=point_labels, cmap='gray')
plt.scatter(test_x['x1'], test_x['x2'], c=test_y, cmap='brg')
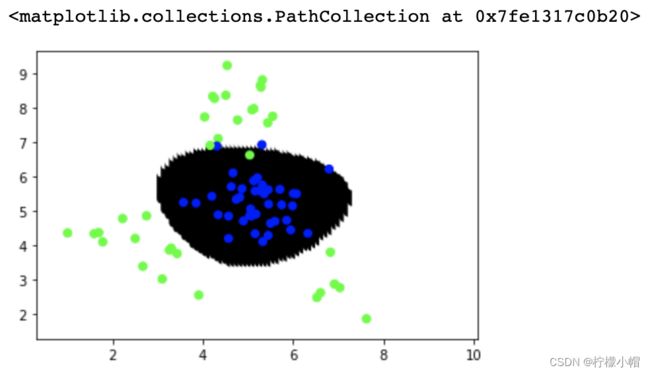
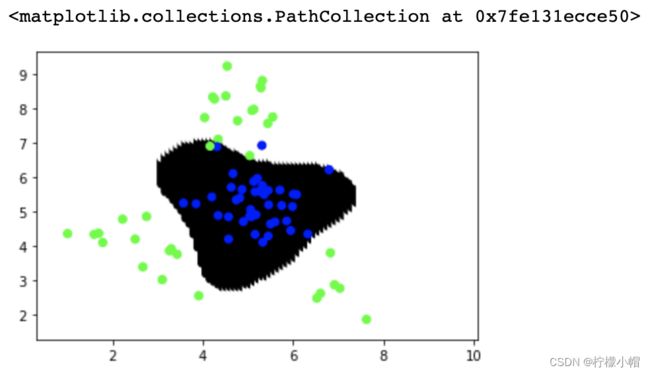
# 多项式核函数
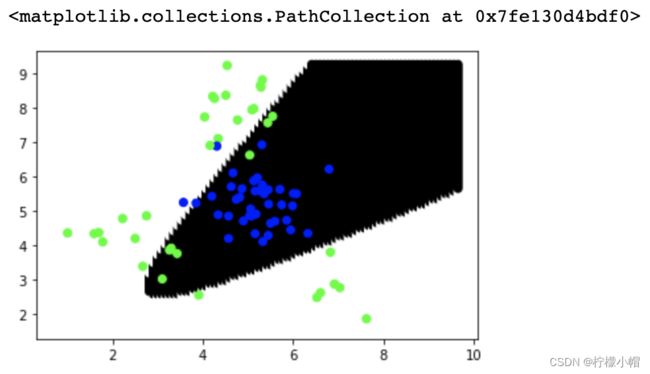
model = svm.SVC(kernel='poly', degree=2)
model.fit(train_x, train_y)
pred_test_y = model.predict(test_x)
print(sm.classification_report(test_y, pred_test_y))
# 预测每个坐标点的类别标签 绘制散点
point_labels = model.predict(points)
plt.scatter(points[:,0], points[:,1], c=point_labels, cmap='gray')
plt.scatter(test_x['x1'], test_x['x2'], c=test_y, cmap='brg')
"""
              precision    recall  f1-score   support

           0       0.84      0.95      0.89        40
           1       0.93      0.80      0.86        35

    accuracy                           0.88        75
   macro avg       0.89      0.88      0.88        75
weighted avg       0.89      0.88      0.88        75
"""
# 径向基核函数
model = svm.SVC(kernel='rbf', C=1, gamma=0.1)
model.fit(train_x, train_y)
pred_test_y = model.predict(test_x)
# print(sm.classification_report(test_y, pred_test_y))
# 预测每个坐标点的类别标签 绘制散点
point_labels = model.predict(points)
plt.scatter(points[:,0], points[:,1], c=point_labels, cmap='gray')
plt.scatter(test_x['x1'], test_x['x2'], c=test_y, cmap='brg')

"""
              precision    recall  f1-score   support

           0       0.97      0.97      0.97        40
           1       0.97      0.97      0.97        35

    accuracy                           0.97        75
   macro avg       0.97      0.97      0.97        75
weighted avg       0.97      0.97      0.97        75
"""
# 通过网格搜索寻求最优超参数组合
model = svm.SVC()

# 网格搜索
params = [{'kernel':['linear'], 'C':[1, 10, 100]},
          {'kernel':['poly'], 'degree':[2, 3]},
          {'kernel':['rbf'], 'C':[1, 10, 100], 'gamma':[1, 0.1, 0.001]}]
model = ms.GridSearchCV(model, params, cv=5)
model.fit(train_x, train_y)
pred_test_y = model.predict(test_x)
# print(sm.classification_report(test_y, pred_test_y))
# 预测每个坐标点的类别标签 绘制散点
point_labels = model.predict(points)
plt.scatter(points[:,0], points[:,1], c=point_labels, cmap='gray')
plt.scatter(test_x['x1'], test_x['x2'], c=test_y, cmap='brg')
print(model.best_params_)
print(model.best_score_)
print(model.best_estimator_)
"""
{'C': 1, 'gamma': 1, 'kernel': 'rbf'}
0.9511111111111111
SVC(C=1, gamma=1)
"""
