项目场景:
echart的环形图表中legend配置项中存在多个重复数据,页面展示的时候合并为一个数据展示了
例如:多个同名业务类型,但是key值不同,需要将所有业务类型都展示。
问题描述
开发中遇到业务类型名称不唯一情况,存在多个业务类型同名但是key值不同,此处多个业务类型应该通过不同颜色将所有类型名都展示,但是实际展示是同名业务类型合并为同一名称,并且颜色相同。
例如:
图表初始化数据代码:
drawChannelChart() {
      // 基于准备好的dom,初始化echarts实例
      this.channelChart = echarts.init(document.getElementById("channelChart"));
      // 绘制图表
      this.channelChart.setOption({
        title: {
          text: "总数",
          //副标题
          subtext: this.channelTotal || "0",
          // 主副标题间距
          itemGap: 15,
          x: "center",
          y: "center",
          // x:'17%',
          //  y:'12%',
          top: "170",
          //主标题样式
          textStyle: {
            fontSize: "18",
            color: "#CCCCCC"
          },
          //副标题样式
          subtextStyle: {
            fontSize: "35",
            fontWeight: "800",
            color: "#555"
          }
        },
        tooltip: {
          trigger: "item"
        },
        legend: {
          top: "95%",
          left: "center",
          // left: '10%',
          icon: "circle",
        },
        series: [
          {
            name: "",
            type: "pie",
            radius: ["40%", "70%"],
            avoidLabelOverlap: false,
            label: {
              show: false,
              position: "center"
            },
            emphasis: {
              label: {
                show: false,
                fontSize: "40",
                fontWeight: "bold"
              }
            },
            labelLine: {
              show: false
            },
            data:  [
                {
                    "key": "1",
                    "name": "超高清",
                    "value": 3
                },
                {
                    "key": "2",
                    "name": "低时延",
                    "value": 1
                },
                {
                    "key": "3",
                    "name": "低时延",
                    "value": 2
                },
            ]
          }
        ]
      });
    },
原因分析:
需求要求,之前没有注意到这方面的问题。
解决方案:
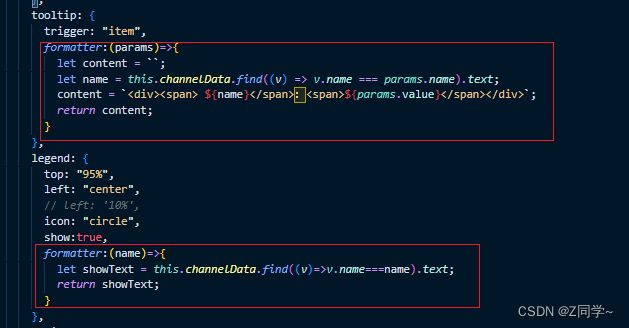
通过legend和tooltip属性的formatter属性值来修改对相同name值数据的展示问题。
首先在获取到数据的时候,对数据进行处理
channelTypes.forEach((element, i) => {
   let obj = {};
   obj.value = element.num || 0;
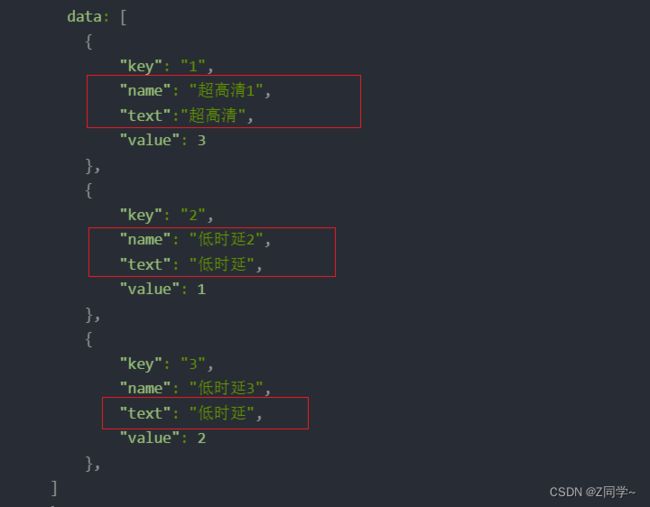
   obj.name = element.value+ element.key;//使用原来的name值+key值作为name唯一的标识
   obj.text = element.value;//预计的展示名称
   obj.key = element.key;
   this.channelData.push(obj);
 });
其次初始化图表设置
drawChannelChart() {
    // 基于准备好的dom,初始化echarts实例
    this.channelChart = echarts.init(document.getElementById("channelChart"));
    // 绘制图表
    this.channelChart.setOption({
      title: {
        text: "总数",
        //副标题
        subtext: this.channelTotal || "0",
        // 主副标题间距
        itemGap: 15,
        x: "center",
        y: "center",
        // x:'17%',
        //  y:'12%',
        top: "170",
        //主标题样式
        textStyle: {
          fontSize: "18",
          color: "#CCCCCC"
        },
        //副标题样式
        subtextStyle: {
          fontSize: "35",
          fontWeight: "800",
          color: "#555"
        }
      },
      tooltip: {
        trigger: "item",
        //此处是针对于修改后数据展示做修改,否则鼠标移上展示的数据是名称+key值
        formatter:(params)=>{
          let content = ``;
          let name = this.channelData.find((v) => v.name === params.name).text;
          content = ` ${name}:${params.value}`;
          return content;
        }
      },
      legend: {
        top: "95%",
        left: "center",
        // left: '10%',
        icon: "circle",
        show:true,
        //此处是针对于修改后数据展示做修改,否则鼠标移上展示的数据是名称+key值
        formatter:(name)=>{
          let showText = this.channelData.find((v)=>v.name===name).text;
          return showText;
        }
      },
      series: [
        {
          name: "",
          type: "pie",
          radius: ["40%", "70%"],
          avoidLabelOverlap: false,
          label: {
            show: false,
            position: "center"
          },
          emphasis: {
            label: {
              show: false,
              fontSize: "40",
              fontWeight: "bold"
            }
          },
          labelLine: {
            show: false
          },
          data: [
            {
                "key": "1",
                "name": "超高清1",
                "text":"超高清",
                "value": 3
            },
            {
                "key": "2",
                "name": "低时延2",
                "text": "低时延",
                "value": 1
            },
            {
                "key": "3",
                "name": "低时延3",
                "text": "低时延",
                "value": 2
            },
        ]
        }
      ]
    });
  },

