机器学习中的线性回归——基于R
机器学习中的线性回归——基于R
- 单变量回归
-
- 一.数据的准备操作,散点图
- 二.进行拟合
- 三.残差的检验
- 多变量线性回归
-
- 一.数据的预处理
- 二.模型的构建与评价
- 线性模型中的其他问题
-
- 一.定性特征
- 二.交互项
alr3包好像已经不能下载了,不过可以用里面的数据
链接:https://pan.baidu.com/s/1xg-V5nPulRf6Tvna26dlTQ?pwd=0s1u
提取码:0s1u
可以在这里下载数据,下载数据后用Rstudio打开就能使用,不需要加载其他东西
单变量回归
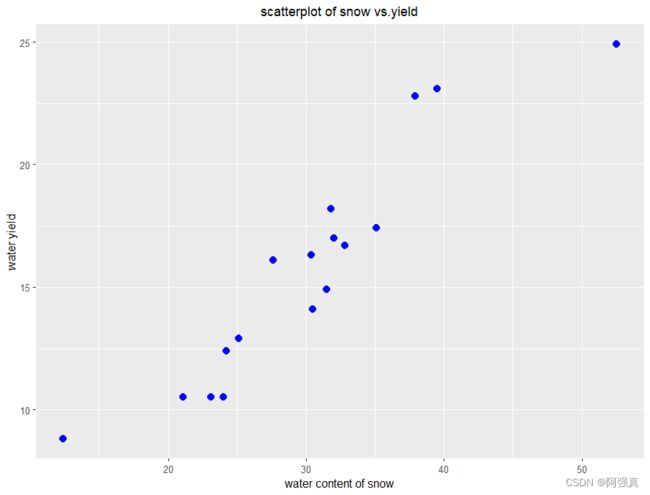
预测怀俄明州蛇河区域的水量 数据:snake
一.数据的准备操作,散点图
library(tidyverse)
snake
names(snake) <- c("content","yield")
a <- ggplot(snake,aes(content,yield))+
  geom_point(colour='blue',shape=19,size=3)+
  labs(x="water content of snow",
       y=" water yield ",
       title = "scatterplot of snow vs.yield")+
  theme(plot.title = element_text(size=12,hjust=0.5))
a
二.进行拟合
#用lm函数进行线性回归
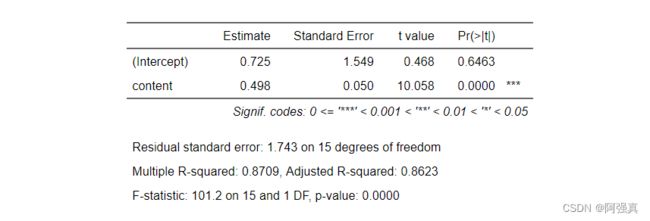
yield.fit <- lm(yield~content,data=snake)
install.packages("flextable")
library(flextable)#用这个包展示结果
as_flextable(yield.fit)
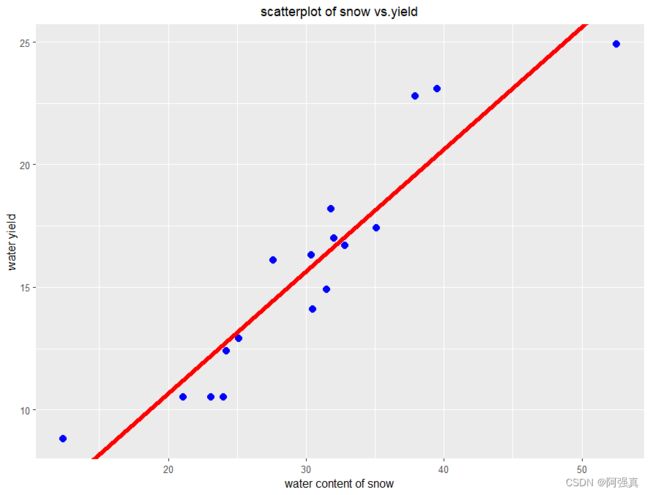
#在原本的散点图中添加直线,看看拟合效果
intercept <- yield.fit$coefficients[[1]]
slope <-yield.fit$coefficients[[2]]
a+geom_abline(slope=slope,intercept=intercept,col='red',size=2)
三.残差的检验
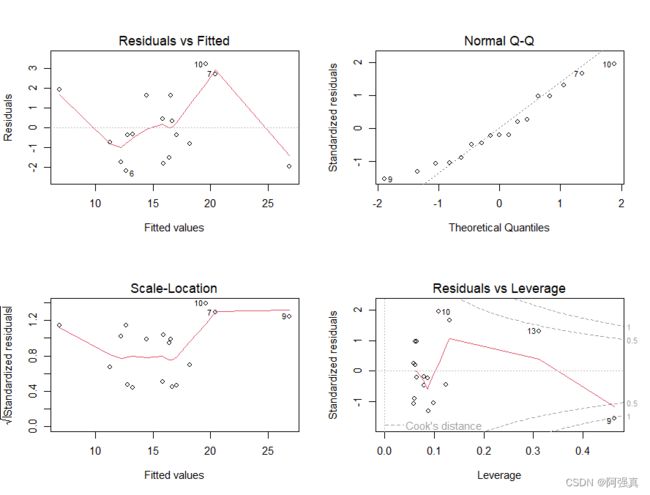
#检验
par(mfrow=c(2,2))
plot(yield.fit)
#有上角的正态QQ图说明基本服从正态分布
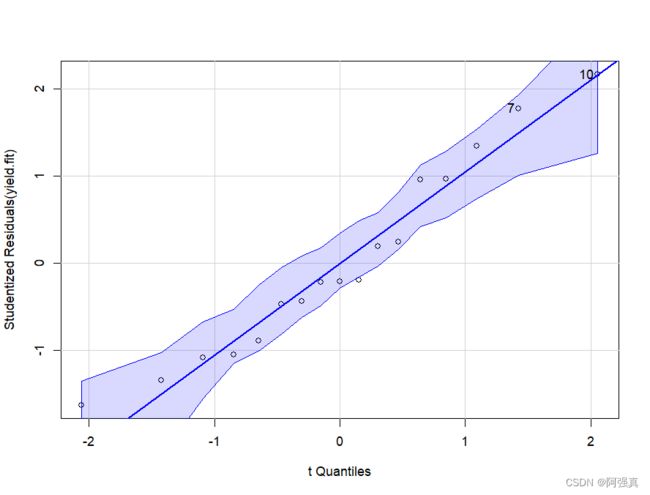
#使用car包中的qqPlot函数检验
library(car)
par(mfrow=c(1,1))
qqPlot(yield.fit)
多变量线性回归
一.数据的预处理
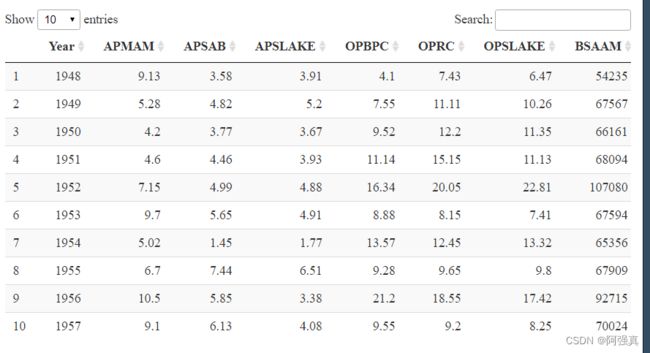
newdata <- water[,-1]#去掉第一列
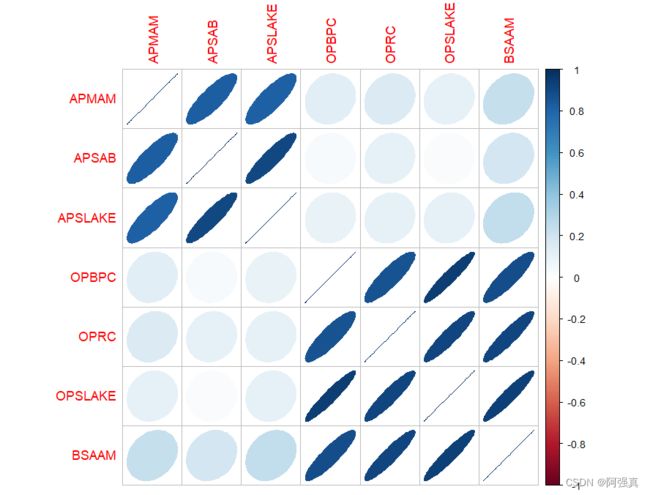
#相关性的检查
library(corrplot)
correlation <- cor(newdata)
corrplot(correlation,method="ellipse")
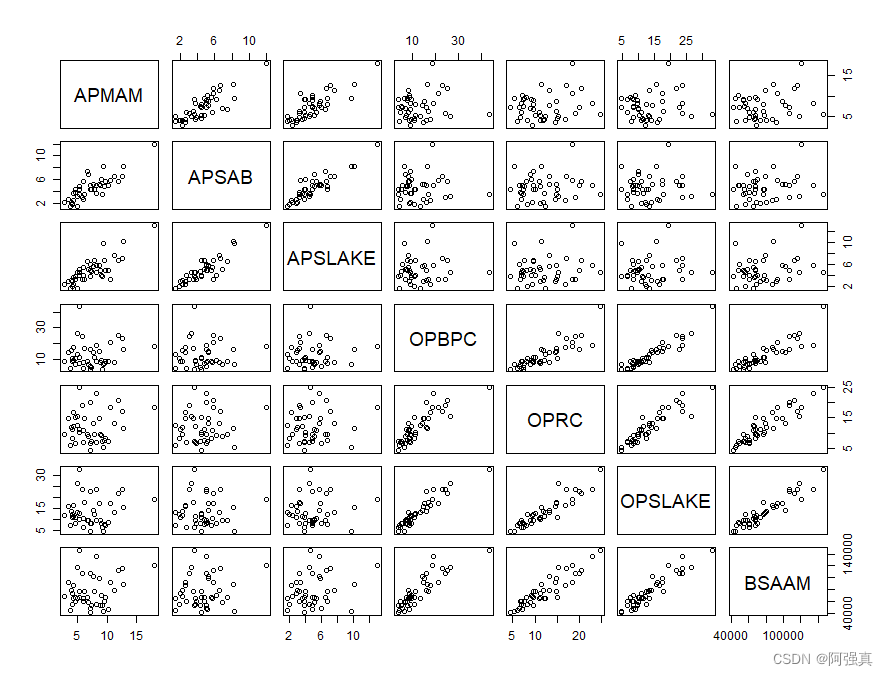
#构建散点图矩阵
pairs(~.,data=newdata)
二.模型的构建与评价
fit <- lm(BSAAM~.,data=newdata)
as_flextable(fit)
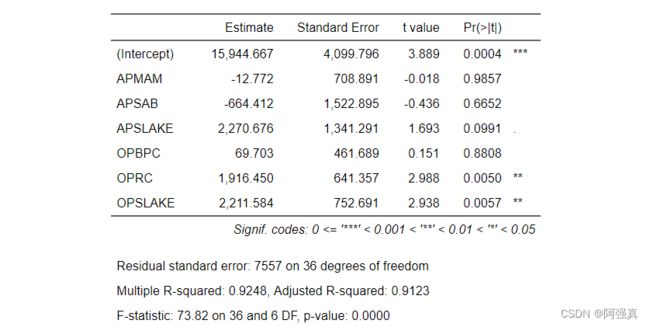
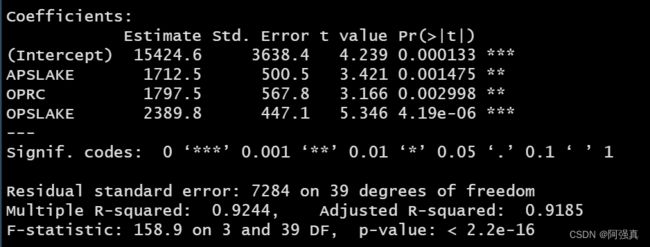
观察可以发现,有几个变量的t统计量p值明显大于0.05,因此考虑采用逐步回归的方法来优化模型
#优化
fit1 <- step(fit)
summary(fit1)
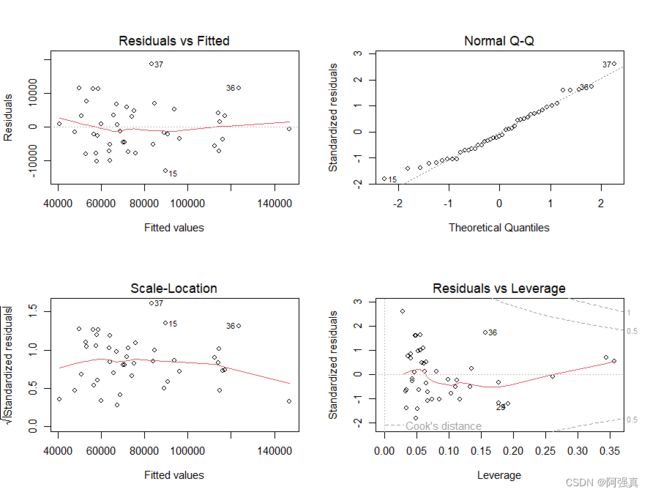
#生成诊断图
par(mfrow=c(2,2))
plot(fit1)
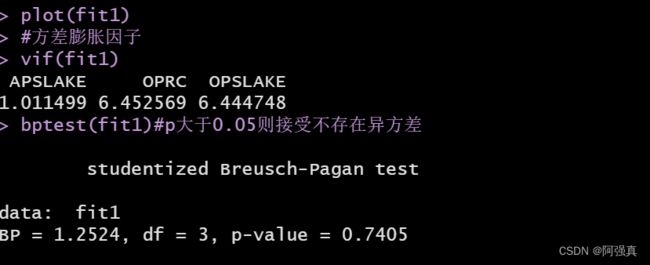
#方差膨胀因子
vif(fit1)
#BP检验
library(lmtest)
bptest(fit1)#p大于0.05则接受不存在异方差
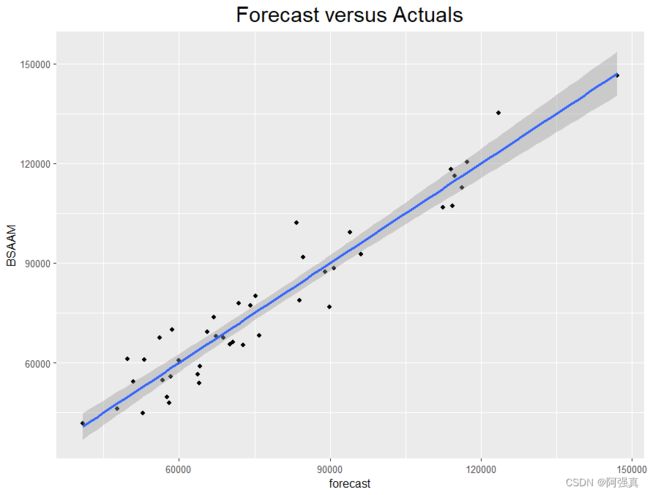
#预测:
newdata$forecast <- predict(fit1)
newdata
ggplot(newdata,aes(forecast,BSAAM))+
  geom_point()+geom_smooth(method="lm")+
  labs(title="Forecast versus Actuals")+
  theme(plot.title = element_text(size=20,hjust=0.5))
逐步回归的结果:
诊断图:
方差膨胀因子和BP检验:
预测值和拟合值
线性模型中的其他问题
一.定性特征
其实就是虚拟变量,比如性别为男则等于1,否则等于0
以ISLR包中的Carseats数据为例:
install.packages("ISLR")
library(ISLR)
data("Carseats")
str(Carseats)
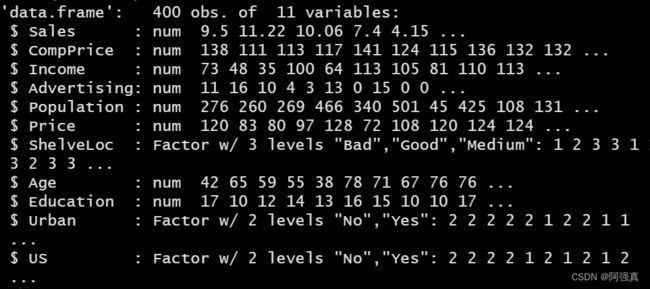
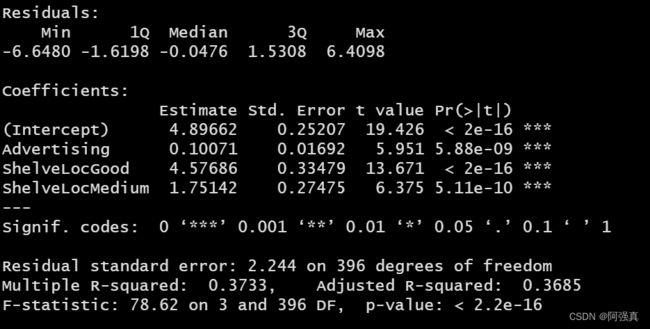
在这个例子中,我们将预测sales变量,对于因子,R会在分析时自动对指标进行编码。模型的建立和分析如下所示:
sale.fit <- lm(Sales~Advertising+ShelveLoc,data=Carseats)
summary(sale.fit)
二.交互项
数据集为MASS包中的Boston数据
library(MASS)
data("Boston")
Boston

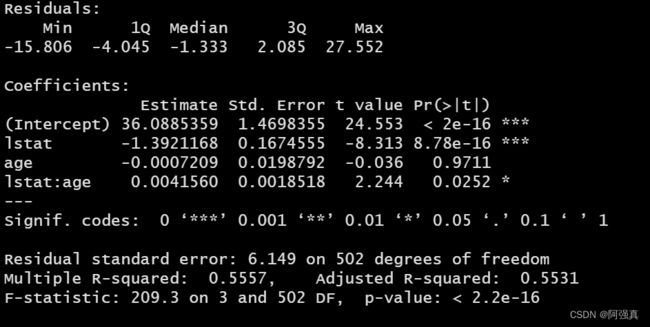
建立medv(房屋价值)关于lstat(低社会经济地位家庭百分比)和age(房屋年龄)带有交互项的模型
lm(medv~lstat*age,data=Boston) %>% summary()
