【数学建模】-聚类模型学习笔记之基于密度的聚类算法DBSCAN算法
学习来源:
清风老师
机器学习聚类算法之DBSCAN
DBSCAN聚类算法——机器学习(理论+图解+python代码
DBSCAN 算法
基本概念
DBSCAN算法迭代可视化展示
DBSCAN是一种基于密度的聚类方法,聚类前不需要预先指定聚类的个数,生成的簇的个数不定(和数据有关)。该算法利用基于密度的聚类的概念,即要求聚类空间中的一定区域内所包含对象(点或其他空间对象)的数目不小于某一给定阈值。该方法能在具有噪声的空间数据库中发现任意形状的簇,可将密度足够大的相邻区域连接,能有效处理异常数据。
DBSCAN算法将数据点分为三类:
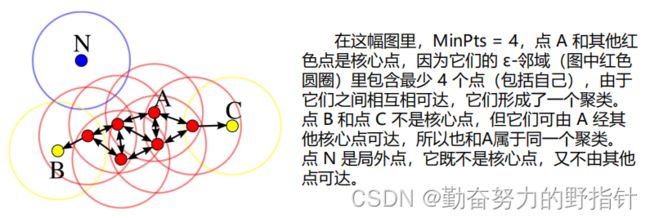
• 核心点:在半径Eps内含有不少于MinPts数目的点
• 边界点:在半径Eps内点的数量小于MinPts,但是落在核心
点的邻域内
• 噪音点:既不是核心点也不是边界点的点
Matlab代码
clc;
clear;
close all;

%% Load Data

load mydata;


%% Run DBSCAN Clustering Algorithm

epsilon=0.5;
MinPts=10;
IDX=DBSCAN(X,epsilon,MinPts);


%% Plot Results
% 如果只要两个指标的话就可以画图啦
PlotClusterinResult(X, IDX);
title(['DBSCAN Clustering (\epsilon = ' num2str(epsilon) ', MinPts = ' num2str(MinPts) ')']);
function [IDX, isnoise]=DBSCAN(X,epsilon,MinPts)

    C=0;

    n=size(X,1);
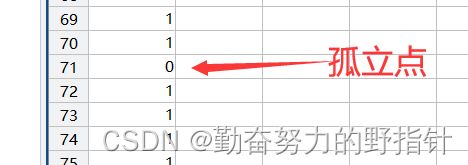
    IDX=zeros(n,1);  % 初始化全部为0,即全部为噪音点

    D=pdist2(X,X);

    visited=false(n,1);
    isnoise=false(n,1);

    for i=1:n
        if ~visited(i)
            visited(i)=true;

            Neighbors=RegionQuery(i);
            if numel(Neighbors)<MinPts
                % X(i,:) is NOISE
                isnoise(i)=true;
            else
                C=C+1;
                ExpandCluster(i,Neighbors,C);
            end

        end

    end

    function ExpandCluster(i,Neighbors,C)
        IDX(i)=C;

        k = 1;
        while true
            j = Neighbors(k);

            if ~visited(j)
                visited(j)=true;
                Neighbors2=RegionQuery(j);
                if numel(Neighbors2)>=MinPts
                    Neighbors=[Neighbors Neighbors2];   %#ok
                end
            end
            if IDX(j)==0
                IDX(j)=C;
            end

            k = k + 1;
            if k > numel(Neighbors)
                break;
            end
        end
    end

    function Neighbors=RegionQuery(i)
        Neighbors=find(D(i,:)<=epsilon);
    end

end
function PlotClusterinResult(X, IDX)

    k=max(IDX);

    Colors=hsv(k);

    Legends = {};
    for i=0:k
        Xi=X(IDX==i,:);
        if i~=0
            Style = 'x';
            MarkerSize = 8;
            Color = Colors(i,:);
            Legends{end+1} = ['Cluster #' num2str(i)];
        else
            Style = 'o';
            MarkerSize = 6;
            Color = [0 0 0];
            if ~isempty(Xi)
                Legends{end+1} = 'Noise';
            end
        end
        if ~isempty(Xi)
            plot(Xi(:,1),Xi(:,2),Style,'MarkerSize',MarkerSize,'Color',Color);
        end
        hold on;
    end
    hold off;
    axis equal;
    grid on;
    legend(Legends);
    legend('Location', 'NorthEastOutside');

end
优缺点
优点
- 基于密度定义,能处理任意形状和大小的簇;
- 可在聚类的同时发现异常点;
- 与K-means比较起来,不需要输入要划分的聚类个数。
缺点
- 对输入参数ε和Minpts敏感,确定参数困难;
- 由于DBSCAN算法中,变量ε和Minpts是全局唯一的,当聚类的密度不均匀时,聚 类距离相差很大时,聚类质量差;
- 当数据量大时,计算密度单元的计算复杂度大。
建议
只有两个指标,且你做出散点图后发现数据表现得很“DBSCAN”,这时候你再用DBSCAN进行聚类。 其他情况下,全部使用系统聚类吧。
K‐means也可以用,不过用了的话你论文上可写的东西比较少。
python代码
from sklearn.cluster import DBSCAN
from sklearn.datasets import make_blobs
import matplotlib.pyplot as plt
import mglearn

X, y = make_blobs(random_state=0, n_samples=12)
dbscan = DBSCAN()
clusters = dbscan.fit_predict(X)
# 都被标记为噪声
print('Cluster memberships:\n{}'.format(clusters))
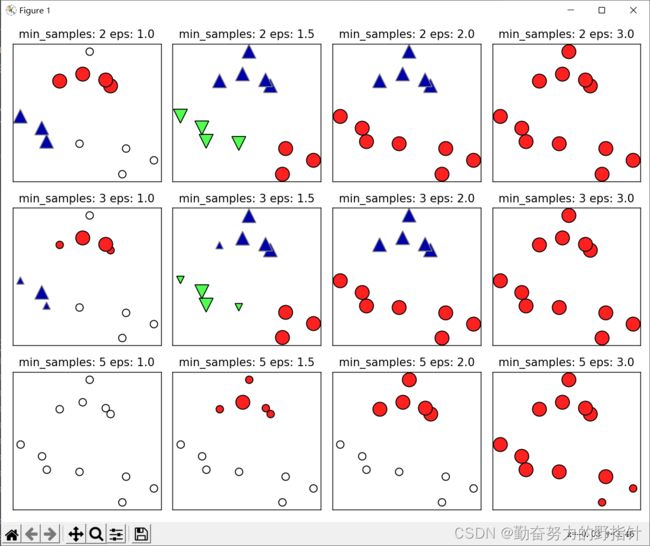
mglearn.plots.plot_dbscan()

plt.show()
# eps: float,ϵ-邻域的距离阈值
# min_samples :int,样本点要成为核心对象所需要的 ϵ-邻域的样本数阈值
# core_sample_indices_ : 核心点的索引,因为labels_不能区分核心点还是边界点,所以需要用这个索引确定核心点
# components_:训练样本的核心点
# labels_:每个点所属集群的标签,-1代表噪声点
Cluster memberships:
[-1 -1 -1 -1 -1 -1 -1 -1 -1 -1 -1 -1]
min_samples: 2 eps: 1.000000  cluster: [-1  0  0 -1  0 -1  1  1  0  1 -1 -1]
min_samples: 2 eps: 1.500000  cluster: [0 1 1 1 1 0 2 2 1 2 2 0]
min_samples: 2 eps: 2.000000  cluster: [0 1 1 1 1 0 0 0 1 0 0 0]
min_samples: 2 eps: 3.000000  cluster: [0 0 0 0 0 0 0 0 0 0 0 0]
min_samples: 3 eps: 1.000000  cluster: [-1  0  0 -1  0 -1  1  1  0  1 -1 -1]
min_samples: 3 eps: 1.500000  cluster: [0 1 1 1 1 0 2 2 1 2 2 0]
min_samples: 3 eps: 2.000000  cluster: [0 1 1 1 1 0 0 0 1 0 0 0]
min_samples: 3 eps: 3.000000  cluster: [0 0 0 0 0 0 0 0 0 0 0 0]
min_samples: 5 eps: 1.000000  cluster: [-1 -1 -1 -1 -1 -1 -1 -1 -1 -1 -1 -1]
min_samples: 5 eps: 1.500000  cluster: [-1  0  0  0  0 -1 -1 -1  0 -1 -1 -1]
min_samples: 5 eps: 2.000000  cluster: [-1  0  0  0  0 -1 -1 -1  0 -1 -1 -1]
min_samples: 5 eps: 3.000000  cluster: [0 0 0 0 0 0 0 0 0 0 0 0]


