机器学习——DBSCAN方法及应用(聚类)
介绍说明
DBSCAN算法是一种基于密度的聚类算法:
聚类的时候不需要预先指定聚类中心(簇)的个数
最终的簇的个数不确定
三类数据点:
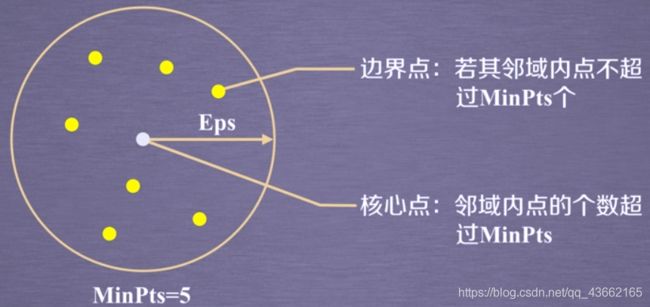
核心点:在半径Eps内含有超过MinPts数目的点。
边界点:在半径Eps内点的数量小于MinPts,但落在核心点的领域内。
噪音点:既不是核心点也不是边界点。
算法流程
A.将所有点标记为核心点、边界点或噪声点。
B.删除噪声点。
C.为距离为Eps之内的所有核心点之间赋予一条边。
D.每组连通的核心点形成一个簇。
E.将每个边界点指派到一个与之关联的核心点的簇中(哪个核心点的半径之类)
实例:
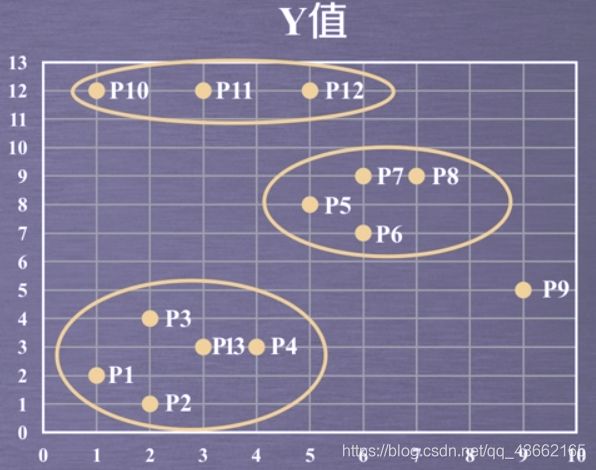
13个样本点
 ①取Eps=3,MinPts=3,依据DBSCAN对所有的点进行聚类(曼哈顿距离)。
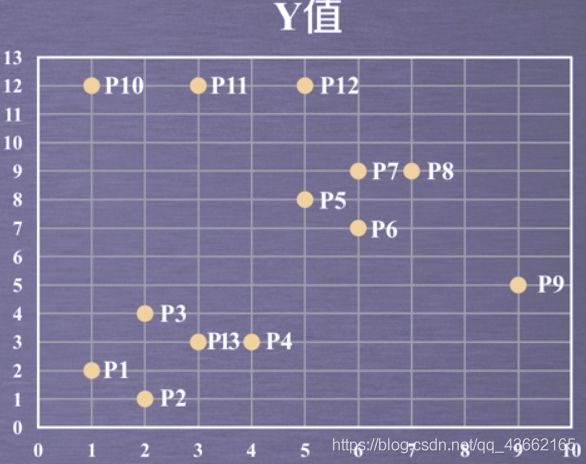 ②对每个点计算其邻域Eps=3内的点的集合。(其中超过MinPts=3的点为核心点,剩余点如果在核心点邻域内则为边界点,反之则为噪声点)
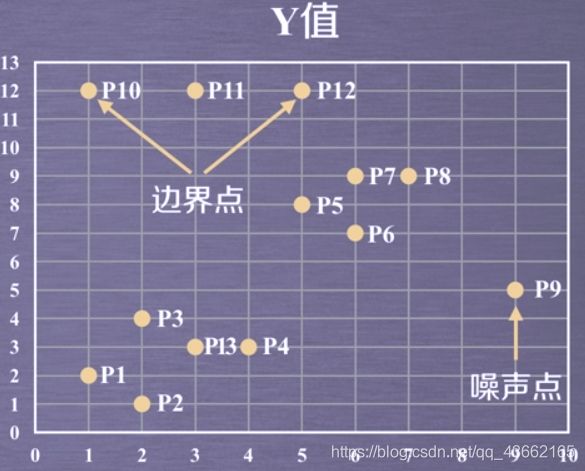 ③将距离不超过Eps=3的点相互连接,构成一个簇,核心点邻域内的点也会被加入到这个簇中。
应用实例
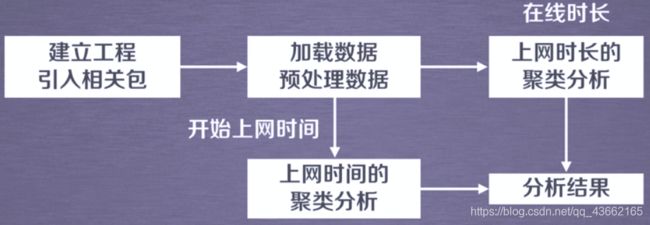
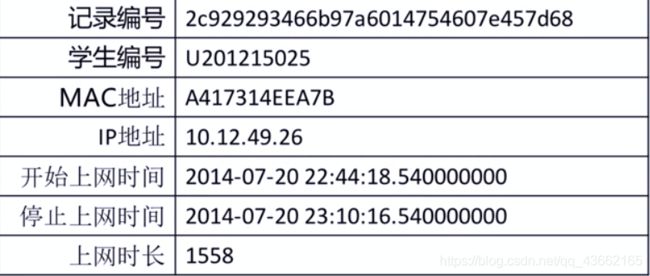
大学校园网的日志数据:用户ID、设备的MAC地址、IP地址、开始上网时间、停止上网时间、上网时长、校园网套餐等,利用已有数据,分析学生上网的模式。
其中,单条数据格式实例为:
 具体的数据(可自行下载):
链接:https://pan.baidu.com/s/1ZTZwNvWhxRsNKhBlQRJQog
提取码:dunk
代码部分
# 1.建立工程,导入sklearn相关包
import numpy as np
import sklearn.cluster as skc
from sklearn.cluster import DBSCAN  # eps:两个样本被看作邻居节点的最大距离 min_samples:簇的样本数 metric:距离计算方式
from sklearn import metrics
import matplotlib.pyplot as plt

# 2.读入数据并进行处理
mac2id = dict()
onlinetimes = []
f = open('TestData.txt', encoding='utf-8')
for line in f:
    mac = line.split(',')[2]
    onlinetime = int(line.split(',')[6])
    starttime = int(line.split(',')[4].split(' ')[1].split(':')[0])
    if mac not in mac2id:
        mac2id[mac] = len(onlinetimes)
        onlinetimes.append((starttime, onlinetime))
    else:
        onlinetimes[mac2id[mac]] = [(starttime, onlinetime)]
real_X = np.array(onlinetimes).reshape((-1, 2))

# 3-1.上网时间聚类,创建DBSCAN算法实例,并进行训练,获得标签:
# 调用DBSCAN方法进行训练,labels为每个数据的簇标签
X = real_X[:, 0: 1]

db = skc.DBSCAN(eps=0.01, min_samples=20).fit(X)
labels = db.labels_

# 打印数据被记上的标签,计算标签为-1,即噪声数据的比例。
print('Labels:')
print(labels)
raito = len(labels[labels[:] == -1]) / len(labels)
print('Noise ratio:', format(raito, '.2%'))

# 计算簇的个数并打印,评价聚类效果。
n_clusters_ = len(set(labels)) - (1 if -1 in labels else 0)

print('Estimated number of clusters: %d' % n_clusters_)
print("Silhouette Coefficient: %0.3f" % metrics.silhouette_score(X, labels))

# 打印各簇标号以及各簇内数据
for i in range(n_clusters_):
    print('Cluster', i, ':')
    print(list(X[labels == i].flatten()))

# 3-2.上网时长聚类,创建DBSCAN算法实例,并进行训练,获得标签:
# X = np.log(1+real_X[:, 1, :])
# db = skc.DBSCAN(eps=0.14, min_samples=10).fit(X)
# labels = db.labels_
#
# print('Labels:')
# print(labels)
# raito = len(labels[labels[:] == -1]) / len(labels)
# print('Noise ratio:', format(raito, '.2%'))
#
# n_clusters_ = len(set(labels)) - (1 if -1 in labels else 0)
#
# print('Estimated number of clusters: %d' % n_clusters_)
# print("Silhouette Coefficient: %0.3f" % metrics.silhouette_score(X, labels))
#
# for i in range(n_clusters_):
#     print('Cluster', i, ':')
#     count = len(X[labels == i])
#     mean = np.mean(real_X[labels == i][:, 1])
#     std = np.std(real_X[labels == i][:, 1])
#     print('\t number of sample: ', count)
#     print('\t mean of sample:', format(mean, '.1f'))
#     print('\t std of sample:', format(std, '.1f'))

plt.hist(X, 24)
结果分析
每个数据被划分的簇的分类
Labels:
[ 0 -1 0 1 -1 1 0 1 2 -1 1 0 1 1 3 -1 -1 3 -1 1 1 -1 1 3
4 -1 1 1 2 0 2 2 -1 0 1 0 0 0 1 3 -1 0 1 1 0 0 2 -1
1 3 1 -1 3 -1 3 0 1 1 2 3 3 -1 -1 -1 0 1 2 1 -1 3 1 1
2 3 0 1 -1 2 0 0 3 2 0 1 -1 1 3 -1 4 2 -1 -1 0 -1 3 -1
0 2 1 -1 -1 2 1 1 2 0 2 1 1 3 3 0 1 2 0 1 0 -1 1 1
3 -1 2 1 3 1 1 1 2 -1 5 -1 1 3 -1 0 1 0 0 1 -1 -1 -1 2
2 0 1 1 3 0 0 0 1 4 4 -1 -1 -1 -1 4 -1 4 4 -1 4 -1 1 2
2 3 0 1 0 -1 1 0 0 1 -1 -1 0 2 1 0 2 -1 1 1 -1 -1 0 1
1 -1 3 1 1 -1 1 1 0 0 -1 0 -1 0 0 2 -1 1 -1 1 0 -1 2 1
3 1 1 -1 1 0 0 -1 0 0 3 2 0 0 5 -1 3 2 -1 5 4 4 4 -1
5 5 -1 4 0 4 4 4 5 4 4 5 5 0 5 4 -1 4 5 5 5 1 5 5
0 5 4 4 -1 4 4 5 4 0 5 4 -1 0 5 5 5 -1 4 5 5 5 5 4
4]
噪声数据的比例、簇的个数、聚类效果评价指标
Noise ratio: 22.15%
Estimated number of clusters: 6
Silhouette Coefficient: 0.710
分成五类
Cluster 0 :
[22, 22, 22, 22, 22, 22, 22, 22, 22, 22, 22, 22, 22, 22, 22, 22, 22, 22, 22, 22, 22, 22, 22, 22, 22, 22, 22, 22, 22, 22, 22, 22, 22, 22, 22, 22, 22, 22, 22, 22, 22, 22, 22, 22, 22, 22, 22, 22, 22, 22, 22, 22, 22, 22, 22]
Cluster 1 :
[23, 23, 23, 23, 23, 23, 23, 23, 23, 23, 23, 23, 23, 23, 23, 23, 23, 23, 23, 23, 23, 23, 23, 23, 23, 23, 23, 23, 23, 23, 23, 23, 23, 23, 23, 23, 23, 23, 23, 23, 23, 23, 23, 23, 23, 23, 23, 23, 23, 23, 23, 23, 23, 23, 23, 23, 23, 23, 23, 23, 23, 23, 23, 23, 23]
Cluster 2 :
[20, 20, 20, 20, 20, 20, 20, 20, 20, 20, 20, 20, 20, 20, 20, 20, 20, 20, 20, 20, 20, 20, 20, 20, 20, 20, 20, 20]
Cluster 3 :
[21, 21, 21, 21, 21, 21, 21, 21, 21, 21, 21, 21, 21, 21, 21, 21, 21, 21, 21, 21, 21, 21, 21, 21, 21]
Cluster 4 :
[8, 8, 8, 8, 8, 8, 8, 8, 8, 8, 8, 8, 8, 8, 8, 8, 8, 8, 8, 8, 8, 8, 8, 8, 8, 8, 8, 8]
Cluster 5 :
[7, 7, 7, 7, 7, 7, 7, 7, 7, 7, 7, 7, 7, 7, 7, 7, 7, 7, 7, 7, 7, 7, 7, 7]
