机器学习Sklearn实战——线性回归
线性回归
import numpy as np
from sklearn.linear_model import LinearRegression
import matplotlib.pyplot as plt
from sklearn import datasets

boston = datasets.load_boston()
X = np.linspace(0,10,50).reshape(-1,1)
y = np.random.randint(2,8,size = 1)*X
lr = LinearRegression()
lr.fit(X,y)
lr.coef_
结果:
array([[6.]])np.linalg.inv(X.T.dot(X)).dot(X.T).dot(y)结果:
array([[6.]])import numpy as np
from sklearn.linear_model import LinearRegression
import matplotlib.pyplot as plt
from sklearn import datasets
boston = datasets.load_boston()
X = boston["data"]
y = boston["target"]
from sklearn.model_selection import train_test_split
X_train,X_test,y_train,y_test = train_test_split(X,y,test_size = 0.2)
lr = LinearRegression(fit_intercept=False) #无节距项
lr.fit(X_train,y_train)
display(lr.coef_)结果:
array([-0.09658799,  0.05599672,  0.03013616,  1.45157192, -4.07971464,
        6.18315919, -0.00863918, -1.07320341,  0.20322344, -0.0119546 ,
       -0.46352335,  0.01637687, -0.34683478])
lr.predict(X_test).round(2)[:25]
y_test[:25]结果:
array([18.26, 37.55, 14.86, 20.53, 22.97, 20.69, 17.65, 32.18, 20.7 ,
       24.66, 28.49, 18.24, 14.52, 19.25, 29.79, 26.76, 10.12, 25.98,
       26.13, 12.63, 34.08, 20.  ,  8.71, 10.48, 25.89])
array([15.2, 38.7, 10.5, 18.7, 21.4, 20.3, 20.1, 32.9, 18.4, 23.1, 24.5,
       16.6,  5.6, 18.3, 23.9, 29.6,  9.7, 27.5, 22.3, 10.9, 32.4, 22. ,
        5. , 15. , 33. ])
lr = LinearRegression(fit_intercept=True) #有节距项
lr.fit(X_train,y_train)
display(lr.coef_,lr.intercept_)结果:
array([-9.94766317e-02,  5.44854535e-02,  6.03291813e-02,  1.50876449e+00,
       -1.76905662e+01,  4.18905856e+00, -4.27011696e-03, -1.57205884e+00,
        3.08980719e-01, -1.45887337e-02, -9.71587245e-01,  1.08299085e-02,
       -4.56869319e-01])
34.23878006740861lr.predict(X_test).round(2)[:15]结果:
array([16.28, 35.99, 13.3 , 21.  , 23.78, 22.35, 18.65, 30.84, 18.93,
24.54, 27.7 , 18.46, 12.88, 19.22, 27.89])(X_test.dot(lr.coef_)+lr.intercept_).round(2)[:15]结果:
array([16.28, 35.99, 13.3 , 21.  , 23.78, 22.35, 18.65, 30.84, 18.93,
       24.54, 27.7 , 18.46, 12.88, 19.22, 27.89])
线性回归——天猫双十一销量预测
import numpy as np
import matplotlib.pyplot as plt
years = np.arange(2009,2020)-2008
sales = np.array([0.5,9.36,52,191,352,571,912,1207,1682.69,2135,2684])

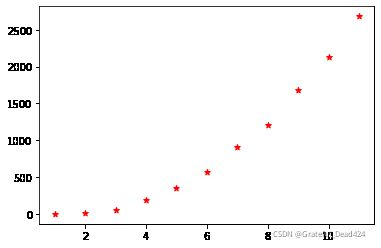
plt.scatter(years,sales,c = "red",marker = "*")
import numpy as np
import matplotlib.pyplot as plt
X = years = np.arange(2009,2020)-2008
y = sales = np.array([0.5,9.36,52,191,352,571,912,1207,1682.69,2135,2684])
X = X.reshape(-1,1)plt.scatter(years,sales,c = "red",marker = "*")from sklearn.linear_model import LinearRegression
lr = LinearRegression(fit_intercept=True)
lr.fit(X,y)
w = lr.coef_[0] #weight权重
b = lr.intercept_ #bias偏差
display(w,b)结果:
267.3102727272729
-713.266181818183
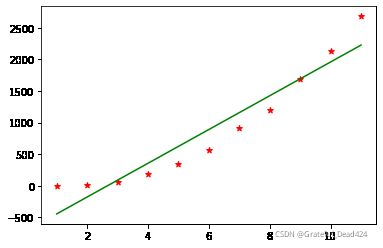
plt.scatter(years,sales,c = "red",marker = "*")
plt.plot(X , w*X+b , c = "green")#假设函数是一元二次f(x) = w1*x**2 + w2*x +b
lr = LinearRegression(fit_intercept=True)
X2 = np.concatenate([X**2,X],axis = 1)
lr.fit(X2,y)
w1,w2 = lr.coef_ #weight权重
b = lr.intercept_ #bias偏差
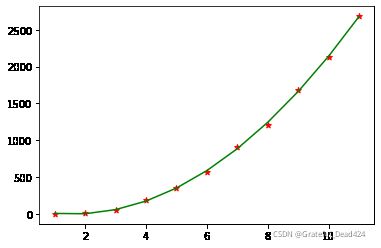
plt.scatter(years,sales,c = "red",marker = "*")
plt.plot(X , w1*X**2+w2*X+b , c = "green")#预测2020销量
f = lambda x:w1*x**2 + w2*x + b
f(12)结果:
3280.062242424243


