IBM Rational Appscan: Part 2 ---reference
http://resources.infosecinstitute.com/appscan-part-2/
By Rohit T|August 16th, 2012
----------------------------------------------------------------------------------------------------------------------------
The first part of this article focused on configuring a scan in Rational Appscan, and as mentioned earlier, it’s important to configure the scan based on your requirements and limitations. Once the scan starts, depending on the size and architecture of the web application, Appscan takes time to explore all the available links. At the end of the scan the security auditor will be presented with scan results which need to be checked to eliminate the false positives. In the first part, we have started our scan on http://demo.testfire.net/ and once the scan gets complete, Appscan shows you a screen as seen in the graphic below. Let’s proceed to analyse.
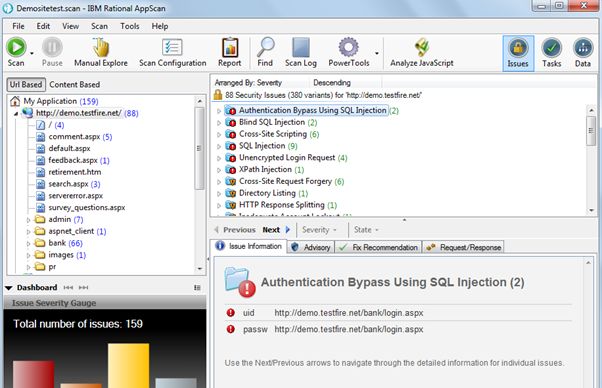
As soon as the scan starts, Appscan asks you if you would like to save the scan. Make sure you save it. When the scan begins, the progress bar appears at the bottom of the screen, which shows you the time taken and also the percentage of the scan that is completed.

During the scan, if you encounter any connectivity issues or any other problems, you can pause the scan and resume it later. As explained earlier, a scan consists of 2 phases – Explore & Test. Scan Expert in Appscan is similar to the ‘Recommendations’ tab in WebInspect. Scan Expert analyses the configuration of the scan and recommends certain changes to the configuration in order to scan more effectively. You can choose to implement them or ignore them.
The screen can be divided roughly into 3 panes: Application Links, Security Issues, and Analysis.
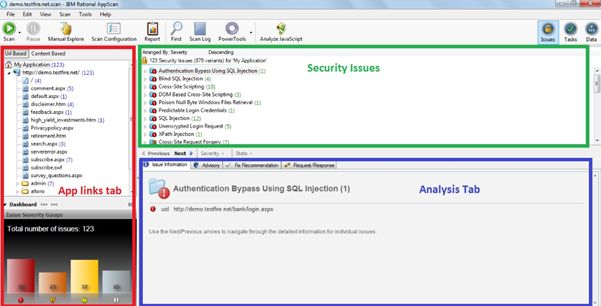
Application Links Pane
Under this, the hierarchical structure of the website is shown. The folders and files of the application are shown in both URL based and content based form. The number of security issues or vulnerabilities present on each link is shown adjacent to it in brackets. By right clicking on a URL or folder you can choose to exclude it from the scan if you are rescanning the application.
The ‘Dashboard’ section will list the total number of issues present based on their severity: High, Medium, Low and informational. So the dashboard will reflect the overall strength of an application.
Security Issues Pane
This tab presents details about the vulnerabilities present in the application. For each vulnerability, the vulnerable pages are listed and the parameters are identified. This can be seen by expanding a particular vulnerability issue as shown below.
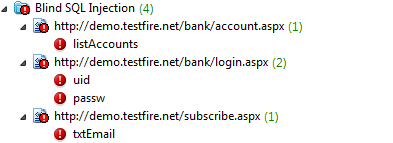
Based on the scan configuration, Appscan identifies various kinds of vulnerabilities ranging from critical issues like ‘SQL Injection’ to low severity vulnerabilities like ‘Email Address Pattern Found’. Because the scan policy selected by us is ‘Default’, Appscan shows us all kinds of vulnerabilities. By right clicking on a particular vulnerability you can change the severity, mark it as non-vulnerable and even delete it.
Analysis Pane
By selecting a particular issue in the security issues tab, the corresponding details can be seen in the analysis pane. These are listed in the following tabs: Issue information, Advisory, Fix Recommendation, Request/Response.
Issue information This tab provides details about the selected vulnerability. It shows the URL and the security risk associated with it. It also suggests what the security analyst needs to do to confirm that it’s a valid finding.
Advisory
Under this tab you can find a technical description of the issue, affected products, and reference links.
Fix Recommendation
This section mentions the steps that need to be taken to address a specific vulnerability. The recommendations are mentioned in general and for both .NET and Java.
Request/Response
This is most significant tab, with specific details about the requests which were sent to the application as part of the tests and the responses associated with them. So within a single test, Appscan might send more than a single request, depending on the issue. For instance, to check a blind SQL injection vulnerability, first the Appscan sends a normal request and records the response. Then it sends an injected parameter as a part of the request, which is a true condition, and records the response. Similarly it sends another request to check the false condition. The malicious payloads will be highlighted in order to differentiate from the others. So for most of the time you will be working in this tab mainly to understand whether the reported vulnerability is a false positive or a valid finding. Under this tab there are a few more options available as shown in the figure below.

Show in Browser – Allows you to see the response in the browser. For instance, if you are viewing a cross site scripting vulnerability in the browser, it actually reflects the alert message which was sent by the Appscan.
Report False Positive – If you find an issue which is to be reported as a false positive to Appscan Support team you can click on this option. Note that this option is not for marking it as a false positive, but for reporting an issue to the Appscan team.
Manual Test – Upon clicking this option, a new window opens and allows you to modify the request and send it to observe the response. This is somewhat similar to the ‘repeater’ option in Burp Suite.
Delete Variant – This will delete it permanently from the results.
Set as Non-vulnerable – The selected variant will be considered as non-vulnerable.
Set as Error Page – Sometimes the application returns a customized error page. By selecting this option here, Appscan will consider all the responses of that type as error pages. Otherwise there is a chance that they might be treated as valid pages because of the 200 OK responses.
The ‘Variant Details’ tab highlights the changes that were applied to the original request.
Understanding the Toolbar

The Scan button helps you to continue a full scan/Explore.
Manual Explore can be used wherein you want to scan only specific URLs or a part of a website. You can record the links and later click on ‘Continue with Full Scan’. Appscan would scan only those links which were covered by you under Manual scan.
Scan Configuration opens the configuration wizard, much of which is covered in the first part.
By clicking on the Report button you can generate a report of the valid findings at the end of the analysis.
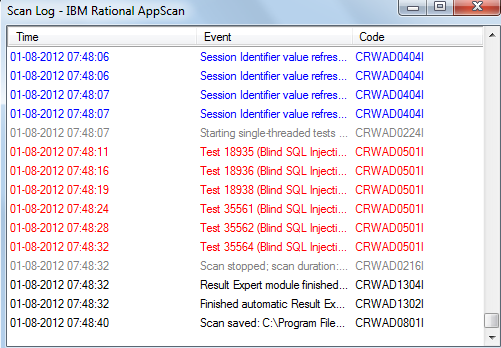
Scan Log records every action performed by Appscan (refer to the figure below). So using this feature, you can track all the activities. For instance, while the scan is running you can view precisely what the Appscan is looking for.
The Power Tools section is explained at the end of this article.
Analyze JavaScript performs JavaScript analysis to discover a wide range of client side issues like DOM based cross site scripting.
You can view various other results under View Application Data. This shows the visited URLs, broken links, JavaScript, cookies, etc.

With this basic understanding of the Appscan tool, you can proceed to analyse the scan results. You may want to address the High severity issues first. We begin the analysis by selecting a vulnerable URL or parameter. For instance if 3 URLs are listed under cross site scripting attack, click on one of them and select the parameter under that URL.

The corresponding details automatically get highlighted in the analysis tab. Now start analysing if it’s a false positive or a valid finding. Determining whether a reported finding is a false positive or a valid finding entirely depends on your technical skills. If it’s a false positive remove the vulnerability from the list by right clicking and then delete. If it’s a valid finding, proceed to the next issue. In this way at the end of the scan, you have a list of vulnerabilities which are only valid findings and you can generate a report including all the issues.
Below are some of the tips which would help you while analysing.
Tips for Analysing
- While analysing the scan results, if you find an issue which is not relevant to your application, you can right click on the vulnerability –> State –> Noise. This will remove the vulnerability completely from the list. In order to show it in the results click on View –> Show issues marked as Noise. This will display the issue in grey text with a strikethrough.
- If the development team comes back with a fix for a particular vulnerability, you don’t have to scan the whole application again (provided the architecture and functionalities remain the same)to retest the issue. Just right click on the URL and select ‘Retest the Issues Found’. If any new issues are found they will be automatically added to the main results.
- CVSS settings help you to adjust the severity ratings that were assigned to a particular vulnerability. To change them, right click on an issue, Severity –> CVSS settings. You can adjust the metrics there (base, temporal and environmental) and change the overall severity rating.
- The ‘Manual Test’ option under the Tools menu helps you to send your own attacks to the application and allows you to save the action under the current scan. After editing the request and sending it, click on save to add the test to the current scan.
- Appscan sends many tests during a scan. Only those tests which uncover the vulnerabilities are shown to you as scan results. But if you want to view the results of all the tests (including non-vulnerable results) you need to select ‘Save Non-vulnerable Test Variant Information’ under Scan Configuration –> Test Options. To view them after completion of a scan, go to View –>Non-vulnerable Variants.
- If you want to scan only particular URLs or a particular section of an application, you can first explore the whole application without testing it (by selecting ‘Start with Automatic Explore Only’ option), and then you can include the URLs which you want to scan by right clicking and selecting ‘Include in Scan’ and exclude others by right clicking and selecting ‘Exclude from Scan’ and then click on ‘Full Scan’.
- When you are scanning a live/production site, Appscan might flood the database with its own data and can even bring the server down. So you need to make sure that the development team is aware of these consequences.
- Test Malware: This will analyse the links in the website for malicious content. You can select this option under Scan –> Test For Malware. The results are added to scan results if any are found.
Generating Reports
At the end of the analysis, you can generate a report of all the valid findings, including the remediation steps that need to be followed in order to fix the issues. These reports can be customized to suit your needs. For instance, you set a template for the development team which is different from a template set for your application manager. Appscan allows you to include various customized fields such as company logo, cover page, report title, etc.

As shown in the above figure, you can include all the parameters that you would like to see by selecting them. The other details under this section are easily understandable.
Tools
This section describes basic details about the Power Tools (Tools –> Power Tools) that Appscan provides you with in order to perform your analysis better.
Authentication Tester
Helps you perform a brute force attack on the username/password combinations to gain access to the web application. But the outcome of this depends on how strong your password policy is.
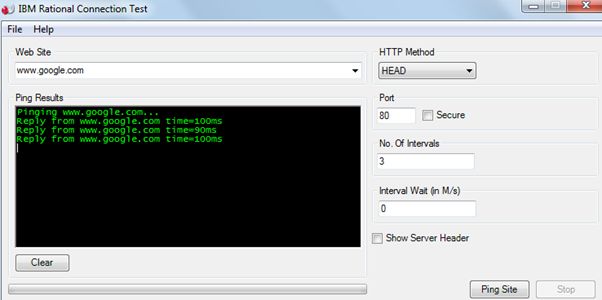
Connection Test
This can be used to ping a website, and nothing more. Ping protocol might be blocked by many protocols and this is where you can use it.
Encode/Decode
While analysing the scan results you might come across many locations where you need to encode and decode the values. This tool can be used for the same purpose.
HTTP Request Editor
This is very useful to play with the HTTP requests. You can modify the values and test how the application reacts to different requests.
This concludes the analysing part of the Rational Appscan. But it’s important to keep in mind that a tool only provides you with the results (or in some cases it may not even provide you with all the results). What’s important from a security analyst’s point of view is the enhancement of technical skills that help us to decide whether a finding is valid or not and to probe further to unearth more vulnerabilities. Happy Scanning!!