opencv 卡尺法 测量边缘距离
opencv 卡尺法 测量边缘距离
参考来源 :https://github.com/crackwitz/metrology-demo
文章目录
- opencv 卡尺法 测量边缘距离
- 前言
- 一、测量方法
- 二、测量步骤
-
- 1.获取直线的像素
- 2.高斯滤波平滑曲线
- 3.计算跳变幅度值
- 4.计算距离值
- 5.显示和保存图片
- 总结
前言
halcon中有按照直线找边缘测量距离的工具,但是opencv中没有类似的工具可以直接实现该测量方式,参考网上的实现方式,可以实现。
一、测量方法
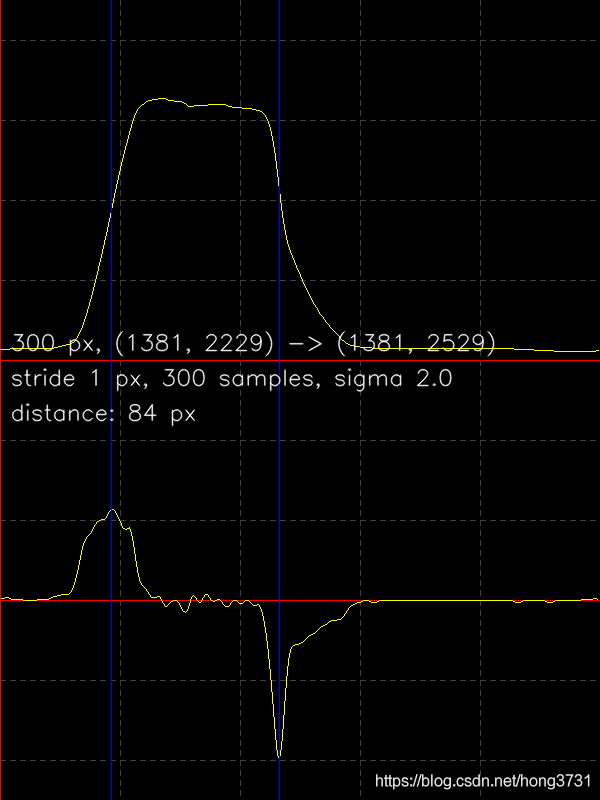
根据测量线的两个端点,获取直线的像素,然后进行滤波过滤噪点,计算跳变幅度,获取最大最小值的位置,计算距离
二、测量步骤
1.获取直线的像素
将直线的通过仿射变换转成1D的图像,可以采用亚像素的算法,先获取仿射变换的矩阵
代码如下(示例):
def build_transform(p0, p1, stride=None, nsamples=None):
	"builds an affine transform with x+ along defined line"
	# use one of stride (in pixels) or nsamples (absolute value)
	(x0, y0) = p0
	(x1, y1) = p1
	dx = x1 - x0
	dy = y1 - y0
	length = np.hypot(dx, dy)
	if nsamples is not None:
		#stride = length / nsamples
		factor = 1 / nsamples
	else:
		if stride is None:
			stride = 1.0
		factor = stride / length
		nsamples = int(round(length / stride))
	# map: src <- dst (use WARP_INVERSE_MAP flag for warpAffine)
	H = np.eye(3, dtype=np.float64) # homography
	H[0:2, 0] = (dx, dy) # x unit vector
	H[0:2, 1] = (-dy, dx) # y unit vector is x rotated by 90 degrees
	x=H[0:2, 0:2]
	H[0:2, 0:2] *= factor
	H[0:2, 2] = (x0, y0) # translate onto starting point
	# take affine part of homography
	assert np.isclose(a=H[2], b=(0,0,1)).all() # we didn't touch those but let's better check
	A = H[0:2, :]
	return (nsamples, A)
然后再采用变换的方法获取图像的像素值
def sample_opencv(im, M, nsamples):
	# use transform to get samples
	# available: INTER_{NEAREST,LINEAR,AREA,CUBIC,LANCOS4)
	samples = cv.warpAffine(im, M=M, dsize=(nsamples, 1), flags=cv.WARP_INVERSE_MAP | cv.INTER_CUBIC )
	# flatten row vector
	samples.shape = (-1,)
	# INTER_CUBIC seems to break down beyond 1/32 sampling (discretizes).
	# there might be fixed point algorithms at work
	return samples
2.高斯滤波平滑曲线
samples = scipy.ndimage.gaussian_filter1d(samples, sigma=args.sigma / args.stride)
3.计算跳变幅度值
# off-by-half in position because for values [0,1,1,0] this returns [+1,0,-1]
gradient = np.diff(samples) / args.stride
4.计算距离值
	i_falling = np.argmin(gradient) # in samples
	i_rising = np.argmax(gradient) # in samples
	distance = np.abs(i_rising - i_falling) * args.stride # in pixels
5.显示和保存图片
	if args.display or args.saveplot:
		gradient *= 255 / np.abs(gradient).max()
		# plot signal
		plot = cv.plot.Plot2d_create(np.arange(nsamples, dtype=np.float64), samples.astype(np.float64))
		plot.setMinY(256+32)
		plot.setMaxY(-32)
		plot.setMinX(0)
		plot.setMaxX(nsamples)
		plot.setGridLinesNumber(5)
		plot.setShowText(False) # callout for specific point, setPointIdxToPrint(index)
		plot.setPlotGridColor((64,)*3)
		canvas1 = plot.render()
		# plot gradient
		plot = cv.plot.Plot2d_create(np.arange(nsamples-1) + 0.5, gradient.astype(np.float64))
		plot.setMinY(256+64)
		plot.setMaxY(-256-64)
		plot.setMinX(0)
		plot.setMaxX(nsamples)
		plot.setGridLinesNumber(5)
		plot.setShowText(False) # callout for specific point, setPointIdxToPrint(index)
		plot.setPlotGridColor((64,)*3)
		canvas2 = plot.render()
		# arrange vertically
		canvas = np.vstack([canvas1, canvas2]) # 600 wide, 800 tall
		# draw lines at edges (largest gradients)
		# plots are 600x400 pixels... and there's no way to plot multiple or plot lines in "plot space"
		px_falling = int(600 * (i_falling+0.5) / nsamples)
		px_rising = int(600 * (i_rising+0.5) / nsamples)
		cv.line(canvas, (px_falling, 0), (px_falling, 400*2), color=(255,0,0))
		cv.line(canvas, (px_rising, 0), (px_rising, 400*2), color=(255,0,0))
		# some text to describe the picture
		cv.putText(canvas, f"{nsamples*args.stride:.0f} px, {p0} -> {p1}",
			(10, 350), cv.FONT_HERSHEY_SIMPLEX, 0.75, (255,255,255), thickness=1, lineType=cv.LINE_AA)
		cv.putText(canvas, f"stride {args.stride} px, {nsamples} samples, sigma {args.sigma}",
			(10, 350+35), cv.FONT_HERSHEY_SIMPLEX, 0.75, (255,255,255), thickness=1, lineType=cv.LINE_AA)
		cv.putText(canvas, f"distance: {distance:.{stride_decimals}f} px",
			(10, 350+70), cv.FONT_HERSHEY_SIMPLEX, 0.75, (255,255,255), thickness=1, lineType=cv.LINE_AA)
		# save for posterity
		if args.saveplot:
			cv.imwrite(args.saveplot, canvas)
		if args.display:
			cv.imshow("plot", canvas)
			cv.line(im_disp,p0,p1,(0,255,0),3)
			# cv.imshow("src", im_disp)
			cv.imwrite('result.jpg',im_disp)
			if args.verbose:
				print("press Ctrl+C in the terminal, or press any key while the imshow() window is focused")
			while True:
				keycode = cv.waitKey(100)
				if keycode == -1:
					continue
				# some key...
				if args.verbose:
					print(f"keycode: {keycode}")
				cv.destroyAllWindows()
				break
总结
提示:显示的程序包含了opencv pilo,这个需要引入opencv-contrib-python模块:
