基于NetworkX构建复杂网络的应用案例
文章目录
- 基于NetworkX构建复杂网络的应用案例
-
- 本文内容
- 1.安装networkx以及校园拓扑图构建
-
- 1.1networkx安装
- 1.2校园拓扑结构绘制
- 2.复杂网络绘制,并指定筛选算法
-
- 2.1生成复杂的网络拓扑节点,同时添加权重
- 2.2对节点的出度分布进行分析
- 2.3通过边的权重绘制不同样式的图,实现对图中节点和边的选择
- 3.总结
基于NetworkX构建复杂网络的应用案例
本文内容
本文主要包含两个部分:
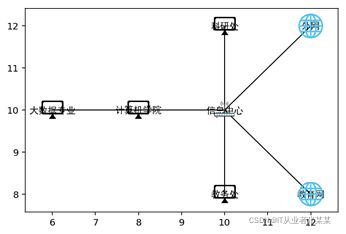
1.networkx的安装以及校园网络拓扑图的绘制。这一步骤有固定生成节点的位置,添加节点的自定义图标的功能实现。
主要函数为:
G.add_nodes_from(nodes=nodes_list,pos=pos)
G.add_node(“信息中心”, image=images[“router”])
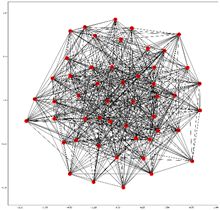
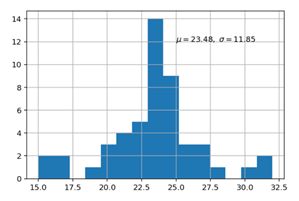
2.基于networkx完成复杂网络拓扑图边的生成。同时给网络拓扑图添加权重节点,生成带权重的复杂网络拓扑图。生成拓扑图后,对节点的出度进行直方图分析,分析其均值mu和方程sigma。然后可以根据传入的边的权重,绘制不同的边的显示样式。
在整体的完成过程在有参考官网,也有参考部分网络博客。官网连接如下:https://networkx.org/documentation/stable/reference/index.html
本报告的具体实现通过代码注释描述
1.安装networkx以及校园拓扑图构建
1.1networkx安装
pip install networkx
需要注意的是,networkx有1.x和2.x的版本,两个版本的用法有所不同,默认安装2.X版本。
1.2校园拓扑结构绘制
打开编译环境,打开jupyter
1)导入依赖库
#加载依赖库
import networkx as nx
from matplotlib import pyplot as plt
import PIL
2)指定画布大小并设定节点,边,位置,图标的基本信息
# 指定画布大小
plt.figure(figsize=(10,10))

# 指定节点
nodes_list = ['计算机学院','大数据专业','信息中心','教务处','科研处','外网','教育网']

# 指定节点的位置
pos = {'计算机学院': (8, 10), '大数据专业': (6, 10),
 '信息中心': (10, 10), '教务处': (10, 8),
 '科研处': (10, 12), '外网': (12, 12),'教育网':(12, 8)}

# 指定边
edge_list = [
('信息中心', '教育网', {'weight': 2}),
('信息中心', '外网', {'weight': 2}),
('计算机学院', '大数据专业', {'weight': 1}),
('计算机学院', '信息中心', {'weight': 2}),
('信息中心', '教务处', {'weight': 2}),
('信息中心', '科研处', {'weight': 2}),
('教务处', '科研处', {'weight': 2})]

# 给网络节点添加指定的图标
# 参考:https://networkx.org/documentation/latest/auto_examples/drawing/plot_custom_node_icons.html
# 网络节点的图标
icons = {
    "router": "icons/路由器.png",
    "internet": "icons/互联网.png",
    "PC": "icons/PC.png",
}

# 加载图标
images = {k: PIL.Image.open(fname) for k, fname in icons.items()}

3)添加节点,边,位置等信息到图中
# 生成一个图
G = nx.Graph()

# 添加所有节点信息
G.add_nodes_from(nodes=nodes_list,pos=pos)

# 添加所有的边信息
G.add_edges_from(edge_list)

# 给节点添加image属性
G.add_node("信息中心", image=images["router"])
G.add_node("教育网", image=images["internet"])
G.add_node("外网", image=images["internet"])
G.add_node("计算机学院", image=images["PC"])
G.add_node("大数据专业", image=images["PC"])
G.add_node("教务处", image=images["PC"])
G.add_node("科研处", image=images["PC"])
3)完成节点的图标叠加
# 构建子图
fig, ax = plt.subplots()

# 绘制网络的边,同时指定ax为子图
nx.draw_networkx_edges(
    G,
    pos=pos,
    ax=ax,
    arrows=True,
    arrowstyle="-",
    min_source_margin=15,
    min_target_margin=15,
)

# 绘制网络图的标签
nx.draw_networkx_labels(G,pos,ax=ax,font_size=10,font_family="simhei")

# 将数据的坐标系缩放为xlim和ylim之间,缩放后为展示图的坐标
tr_figure = ax.transData.transform
# 将展示的坐标系转换为绘图坐标系
tr_axes = fig.transFigure.inverted().transform

# 设定每个图标的大小以及图标中心位置
icon_size = (ax.get_xlim()[1] - ax.get_xlim()[0]) * 0.0125
icon_center = icon_size / 2.0

# 将图标添加到各自的节点上
for n in G.nodes:
    # pos[n]为每个节点的原始位置
    xf, yf = tr_figure(pos[n])
    # 将 节点坐标 转换为 画布上的坐标
    xa, ya = tr_axes((xf, yf))
    # get overlapped axes and plot icon
    # 获得重叠 的  子图 和 节点图标
    a = plt.axes([xa - icon_center, ya - icon_center, icon_size, icon_size])
    a.imshow(G.nodes[n]["image"])
    a.axis("off")

plt.show()
2.复杂网络绘制,并指定筛选算法
2.1生成复杂的网络拓扑节点,同时添加权重
# 导入相关依赖
from matplotlib import pyplot as plt
import networkx as nx
import numpy as np

# 生成随机数据
G = nx.erdos_renyi_graph(50,0.5)

# 指定画布大小
plt.figure(figsize=(18,18))

# 生成新的图
G_new = nx.Graph()

# 依据图中边的数量,生成同样长度的随机权重值
weightList = {}
for i in range(len(G.edges())+1):
    weightList[i] = np.random.rand()

# 将生成的随机权重复制给G_new图
i = 0
for edge in G.edges():
    i += 1
    G_new.add_edges_from([(edge[0], edge[1], {'weight': weightList[i]})])
# 绘制G_new图
nx.draw_networkx(G_new)
plt.show()
2.2对节点的出度分布进行分析
描述数据分布时,可通过mu, sigma表示,本部分使用scipy的统计函数,计算sigma值,再计算出mu值,然后对网络的degree值,通过直方图展示出来。
代码如下:
# 将网络中节点的degree转换为字典类型
de = dict(G_new.degree)
print(de)
# keys为节点的id,values为节点对应的出度
keys = [de[v] for v in de.keys()]
values = [v for v in de.values()]

# 计算均值和标准差
N = len(values)
narray=np.array(values)
sum1=narray.sum()
narray2=narray*narray
sum2=narray2.sum()
mean=sum1/N
var=sum2/N-mean**2
var =np.around(var,2)

# 绘制直方图
plt.hist(values,bins=15)

# 添加注释信息
plt.text(25, 12, r'$\mu={},\ \sigma={}$'.format(mean,var))    #文本中注释
plt.grid(True)

plt.show()
2.3通过边的权重绘制不同样式的图,实现对图中节点和边的选择
这里采用输入最大权重和最小权重2个参数,筛选出3份不同的边,然后采用不同的样式进行绘制。
具体代码如下:
## 设置显示图像的方式
%matplotlib inline
%config InlineBackend.figure_format = "retina"
plt.figure(figsize=(18,18))

# 获取最大和最小权重")
elarge_num = input("输入最大的权重")
if len(elarge_num)<2:
    elarge_num = 0.3
else:
    elarge_num = float(elarge_num)

emidle_num = input("输出最下的权重")
if len(emidle_num)<2:
    emidle_num = 0.3
else:
    emidle_num = float(emidle_num)

## 根据输入的边的权重,筛选出不同边
elarge=[(u,v) for (u,v,d) in G_new.edges(data=True) if d['weight'] >elarge_num]
emidle = [(u,v) for (u,v,d) in G_new.edges(data=True) if (d['weight'] >emidle_num) & (d['weight'] <= elarge_num)]
esmall=[(u,v) for (u,v,d) in G_new.edges(data=True) if d['weight'] <=emidle_num]

# 图的布局,获取所有节点的位置
pos=nx.random_layout(G_new) # positions for all nodes

# 获取度的信息
de = dict(G_new.degree)
keys = [de[v] for v in de.keys()]
values = [v for v in de.values()]

# nodes根据节点来设置节点的大小
nx.draw_networkx_nodes(G_new,pos,alpha=0.6,node_size=keys * 100)

# 根据筛选后的edges绘制不同的网络
nx.draw_networkx_edges(G_new,pos,edgelist=elarge,
                    width=2,alpha=0.9,edge_color='g')
nx.draw_networkx_edges(G_new,pos,edgelist=emidle,
                    width=1.5,alpha=0.6,edge_color='y')
nx.draw_networkx_edges(G_new,pos,edgelist=esmall,
                    width=1,alpha=0.3,edge_color='b',style='dashed')

# 设置标签为黑体,便于显示中文
nx.draw_networkx_labels(G_new,pos,font_size=10,font_family="simHei")

plt.axis('off')
plt.title("复杂模型衡量",FontProperties = font)
plt.show() # display
3.总结
本文主要完成了networkx的安装以及校园网络拓扑图的绘制,又完成了根据权重筛选节点的功能。这里面比较使用的功能在于可以固定生成节点的位置,添加节点的自定义图标,以及根据权重,出入度等值完成节点筛选。


