机器学习sklearn实战-----泰坦尼克号分类预测决策树
机器学习sklearn实战—决策树
决策树理论、基础、调参、以及实例泰坦尼克号预测
文章目录
- 机器学习sklearn实战---决策树
- 前言
-
- 一、Sklearn入门?
- 二、决策树
- 1.决策树的原理
- 2.sklearn中的决策树
- 3.红酒数据进行分类
-
- 决策树实战之泰坦尼克号预测分类
- 总结
前言
机器学习,sklearn入门与决策树实战
一、Sklearn入门?
官网:https://scikit-learn.org
二、决策树
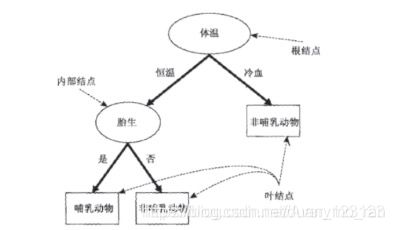
1.决策树的原理
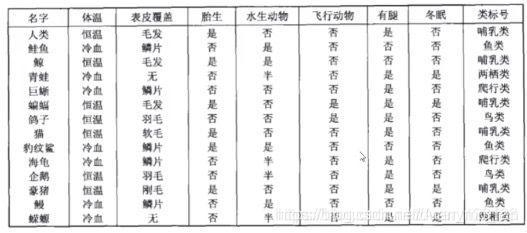
决策树算法的核心是要解决两个问题:
1)如何从数据表中找到最佳节点和最佳分枝叶?
2)如何让决策树停止生长,防止过拟合?
2.sklearn中的决策树
在sklearn库中已经有很完整的关于决策树的一些方法

在对决策树进行可视化时,除了安装graphviz,还需要在计算机外部下载raphviz文件并配置路径
3.红酒数据进行分类
python中自带数据集load_wine,第一步是先进行加载数据
#决策树
#决策树
from sklearn.tree import DecisionTreeRegressor,DecisionTreeClassifier   #分为分类树  回归树  信息熵、基尼系数
from sklearn import tree  #criterion决定 不纯度
from sklearn.datasets import load_wine
from sklearn.model_selection import train_test_split
#tree = DecisionTreeRegressor()
wine = load_wine()
pd.concat([pd.DataFrame(wine.data), pd.DataFrame(wine.target)], axis=1)  #先将数据转化为DateFrame,再组合起来
定义数据标签,将数据分为训练和测试数据,决策树初始化,进行训练模型,最后计算出预测精度,利用zip函数组合每个特征的贡献程度。
feature_name = ['alcohol',    #标签
                     'malic_acid',
                     'ash',
                     'alcalinity_of_ash',
                     'magnesium',
                     'total_phenols',
                     'flavanoids',
                     'nonflavanoid_phenols',
                     'proanthocyanins',
                     'color_intensity',
                     'hue',
                     'od280/od315_of_diluted_wines',
                     'proline']
x_train, x_test, y_train, y_test = train_test_split(wine.data, wine.target,test_size=0.25)
clf = DecisionTreeClassifier(criterion="entropy")#分类树  信息熵  防止过拟合
model = clf.fit(x_train, y_train)
print("预测精度为:", model.score(x_test, y_test))
[*zip(feature_name,model.feature_importances_)]
最后对决策树进行可视化
import graphviz  #做可视化
#画出决策树图
feature_name = ['alcohol',    #标签
 'malic_acid',
 'ash',
 'alcalinity_of_ash',
 'magnesium',
 'total_phenols',
 'flavanoids',
 'nonflavanoid_phenols',
 'proanthocyanins',
 'color_intensity',
 'hue',
 'od280/od315_of_diluted_wines',
 'proline']
dot_data = tree.export_graphviz(model
                                , feature_names=feature_name
                                , class_names=["琴酒", "雪梨", "贝尔摩德"]
                                , filled=True #填充颜色
                                , rounded=True#圆形轮廓

)
graph = graphviz.Source(dot_data)
graph
其中export_graphviz中有一些参数,filled是定义是否填充颜色,颜色的深浅可以表示不纯度的大小(信息熵),rounded定义为是否使用圆形轮廓。

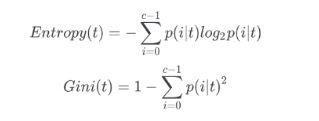
在决策树模型中,我们增加一些参数来增加模型的精确度,比如criterion,criterion="entropy"表示模型使用的是信息熵计算,一般使用信息熵的计算速度会慢一些,因为会计算到log,criterion="gini"使用的是基尼系数,比起基尼系数,信息熵对不纯度更加敏感,对不纯度的惩罚最强。
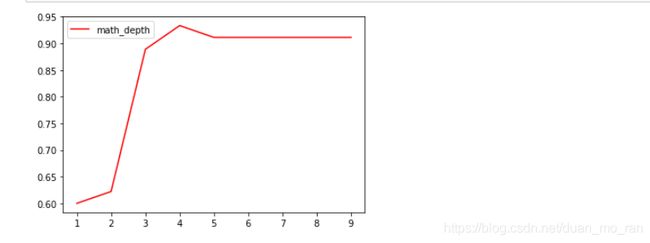
max_depth确定树的深度,random_state用来设置分枝中的随机模式参数,默认为None,输出一个稳定的树,splitter也是用来控制决策树中的随机选项。
这里是设定树的深度从1到9遍历,计算模型的精确度。
'''
减枝优化 参数优化
'''
import matplotlib.pyplot as plt
score_list = []
for i in range(1,10):
    model = tree.DecisionTreeClassifier(criterion="entropy"
                                        , max_depth=i
                                        , random_state=30
                                        , splitter="random")
    model = model.fit(x_train,y_train)
    score = model.score(x_test,y_test)
    score_list.append(score)
plt.plot(range(1,10),score_list, color = 'r',label = "math_depth")   #画出调参的图像
plt.legend()
plt.show()
决策树实战之泰坦尼克号预测分类
同上面一样,我们需要先导进数据,但是由于数据量相对于红酒偏大,同时应该查看数据类型以及数据情况。
import pandas as pd
import numpy as np
from sklearn.model_selection import train_test_split, cross_val_score,GridSearchCV  #交叉验证、网格搜索
from sklearn.tree import DecisionTreeClassifier
data = pd.read_csv("C:/Users/1\Desktop/titanic/train.csv" )
data.info()
data.head(5)
data.info()是查看数据的基本情况,例如数据量以及数据类型,字段名等。
先对一下特征进行处理,删掉对于我们没有信息的数据。在这里删掉了"PassengerId",“Name”,“Cabin”,"Ticket"四个字段。
data.drop(["PassengerId","Name","Cabin","Ticket"],inplace=True,axis=1)
处理缺失值数据,之前我们可以看到Age这个字段数据量缺失比较大,但是年纪对于我们的预测又有比较重要的影响,所以我们利用均值对缺失值进行填补。
#处理缺失值
data["Age"] = data["Age"].fillna(data["Age"].mean())
#data.info()
data = data.dropna()
data.info()
在很多的机器学习算法中只能对数值型数据进行建模预测,所以在这里我们需要将字符型数据进行处理,在Embarked字段中有三种类型,由于他们之间没有等级联系,用0,1,2,表示。如果数据是顺序型数据并不能简单的利用这种。
同时对性别字符数据进行处理,为0,1。
#处理字符型数据
label= data["Embarked"].unique().tolist()
data["Embarked"] = data["Embarked"].apply(lambda x: label.index(x))  #独立没有联系
data

data["Sex"]=(data["Sex"]=="male").astype("int")
接下来就是对数据进行分类,训练数据以及测试数据,由于之前数据类型是DataFram,随机拆分数据会导致前面的序号不对,为了不影响后面操作,用一个for循环将数据按照顺序进行排序。
X = data.iloc[:,data.columns!="Survived"]
Y = data.iloc[:,data.columns=="Survived"]
x_train,x_test,y_train,y_test = train_test_split(X,Y,test_size=0.3)
for i in [x_train,x_test,y_train,y_test]:
    i.index = range(i.shape[0])
训练模型,在这里加入了交叉验证,同时画出训练数据精确度以及测试数据精确度的图像。
交叉验证:交叉验证是用来观察模型稳定性的一种方法,我们将数据划分为n份,依次使用其中一份作为测试集,其他n-1份作为训练集,多次计算模型的精确性来评估模型的平均准确度。
训练集和测试集的划分会干扰模型的结果,因此用交叉验证n次的结果求出平均值,是对模型效果的一个最好的度量。一般使用10折交叉验证。
import matplotlib.pyplot as plt
model = DecisionTreeClassifier(random_state=30)
model = model.fit(x_train,y_train)
print("模型的精确度为:",model.score(x_test,y_test))
#进行参数调节
ts = [];tr = []#定义两个列表保存精确度
for i in range(1,10):
    model = DecisionTreeClassifier(random_state=30
                                   ,max_depth=i)
    model =model.fit(x_train,y_train)
    #加入交叉验证
    score_ts = cross_val_score(model,X,Y,cv=10).mean()
    tr.append(model.score(x_train,y_train))
    ts.append(score_ts)
plt.plot(range(1,10),tr,color = "r",label = "train")
plt.plot(range(1,10),ts,color = "b",label = "test")
plt.xticks(range(1,10))
plt.show()
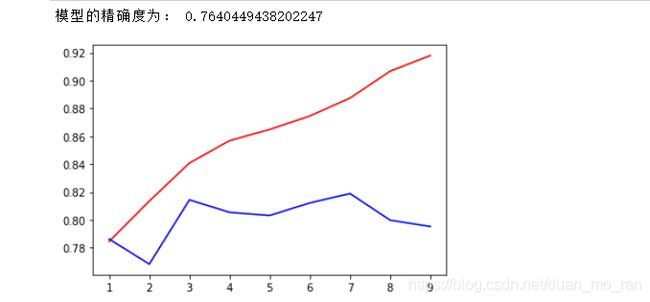
其实好像在max_depth等于三的时候模型的效果会更好,但是总体的精确度也不是很高。接下来,再在模型中加入网格搜素。
#网格搜素
gini_thresholds = np.linspace(0,0.5,20)
parameters = {'splitter':('best','random'),
              'criterion':("gini","entropy"),
              "max_depth":[*range(1,10)],
              'min_samples_leaf':[*range(1,50,5)],
              'min_impurity_decrease':[*np.linspace(0,0.5,20)]
             }
model = DecisionTreeClassifier(random_state=25)
GS = GridSearchCV(model,parameters,cv = 10)
GS = GS.fit(x_train,y_train)
GS.best_params_
GS.best_score_

遍历之后,可以等到在模型最好时的参数选择,但是其实进行网格搜索之后的精确度也没有之前高,是因为网格搜索虽然是可以遍历设置好的参数,但是它不能删去一些参数,比如说已经有两个参数的组合达到最优,但是由于设置了多个参数,它最后还是会加上这些参数。所以这也告诉我们,在利用网格搜索时,怎么设置参数的个数组合。
