猿创征文|机器学习实战(8)——随机森林
目录
1 随机森林
2 极端随机树
3 特征重要性
4 提升法
4.1 AdaBoost
4.2 梯度提升
机器学习实战(7)中我们已经提到,随机森林是决策树的集成,通常用bagging方法训练,训练集大小通过max_samples来设置。除了先构建一个 BaggingClassifier 然后将结果传输到 DecisionTreeClassifier ,还有一种方法就是使用 RandomForestClassifier 类(对于回归任务有RandomForestRegressor类),这种方法更方便。
1 随机森林
常规模块的导入以及图像可视化的设置:(注意,本节是基于第7节集成学习的代码继续往下演示的)
# Common imports
import numpy as np
import os

# to make this notebook's output stable across runs
np.random.seed(42)

# To plot pretty figures
%matplotlib inline
import matplotlib as mpl
import matplotlib.pyplot as plt
mpl.rc('axes', labelsize=14)
mpl.rc('xtick', labelsize=12)
mpl.rc('ytick', labelsize=12)
以下代码训练一个拥有500棵树的随机森林分类器(其中每棵树限制为最多16个叶节点):
from sklearn.ensemble import RandomForestClassifier

rnd_clf = RandomForestClassifier(n_estimators=500, max_leaf_nodes=16, n_jobs=-1, random_state=42)
rnd_clf.fit(X_train, y_train)

y_pred_rf = rnd_clf.predict(X_test)

np.sum(y_pred == y_pred_rf) / len(y_pred)  # almost identical predictions
运行结果如下:
0.936除了少数例外(没有splitter(强制为random),没有presort(强制为False),没有max_samples(强制为1.0),没有base_estimator(强制为DecisionTreeClassifier)),RandomForestClassifier 具有 DecisionTreeClassifier 和 BaggingClassifier 的所有超参数,前者用来控制树的生长,后者用来控制集成本身。
用 BaggingClassifier 实现与上述代码效果相同的效果:
bag_clf = BaggingClassifier(
    DecisionTreeClassifier(splitter="random", max_leaf_nodes=16, random_state=42),
    n_estimators=500, max_samples=1.0, bootstrap=True, n_jobs=-1, random_state=42)

bag_clf.fit(X_train, y_train)
y_pred = bag_clf.predict(X_test)

from sklearn.metrics import accuracy_score
accuracy_score(y_test, y_pred)
运行结果如下:
0.922 极端随机树
随机森林里单棵树的生长过程中,每个节点在分裂时仅考虑到一个随机子集所包含的特征。如果我们对每个特征使用随机阈值,而不是搜索得出的最佳阈值,则可能让决策树生产得更随机。这种极端随机的决策树组成的森林被称为极端随机树。同样,它也是以更高的偏差换取了更低的方差。
我们使用Scikit-Learn的 ExtraTreeClassifier 可以创建一个极端随机树分类器。
我们很难预先知道一个 RandomForestClassifier 是否比一个 ExtraTreeClassifier 更好或是更差,只有两种都尝试一遍,然后使用交叉验证进行比较。
3 特征重要性
我们查看单个决策树会发现,重要的特征更可能出现在靠近根节点的位置,而不重要的特征通常出现在靠近叶节点的位置。因此,通过计算一个特征在森林中所有树上的平均深度,就可以估算出一个特征的重要程度。Scikit-Learn 在训练结束后自动计算每个特征的重要性。
例如下列代码:
from sklearn.datasets import load_iris
iris = load_iris()
rnd_clf = RandomForestClassifier(n_estimators=500, n_jobs=-1, random_state=42)
rnd_clf.fit(iris["data"], iris["target"])
for name, score in zip(iris["feature_names"], rnd_clf.feature_importances_):
    print(name, score)
运行结果如下:
sepal length (cm) 0.11249225099876375
sepal width (cm) 0.02311928828251033
petal length (cm) 0.4410304643639577
petal width (cm) 0.4233579963547682
从结果来看,花瓣长度(44%)和宽度(42%)特征比较重要。
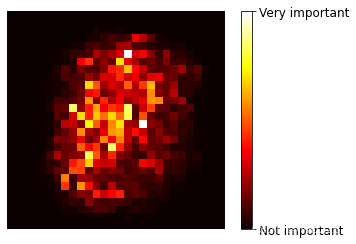
我们前面曾用到过MNIST数据集,如果我们也训练一个随机森林分类器,然后绘制每个像素的重要性:
from sklearn.datasets import fetch_openml
#加载数据
mnist = fetch_openml('mnist_784', version=1, cache=True, as_frame=False)
mnist.target = mnist.target.astype(np.int64)

#训练
rnd_clf = RandomForestClassifier(n_estimators=10, random_state=42)
rnd_clf.fit(mnist["data"], mnist["target"])

def plot_digit(data):
    image = data.reshape(28, 28)
    plt.imshow(image, cmap = mpl.cm.hot,
               interpolation="nearest")
    plt.axis("off")

#可视化
plot_digit(rnd_clf.feature_importances_)

cbar = plt.colorbar(ticks=[rnd_clf.feature_importances_.min(), rnd_clf.feature_importances_.max()])
cbar.ax.set_yticklabels(['Not important', 'Very important'])

plt.show()
运行结果如下:
因此,我们可以通过随机森林对重要特征进行选择。
4 提升法
提升法是指可以将几个弱学习结合成一个强学习器的任意集成方法。
4.1 AdaBoost
新预测器对其前序进行纠正的办法之一,就是更多地关注前序拟合不足的训练实例。从而使新的预测器不断地越来越专注于难缠的问题,这就是 AdaBoost 使用的技术。
例如,要构建一个 AdaBoost 分类器,首先需要训练一个基础分类器,用它对训练集进行预测,然后对错误分类的训练实例增加其相对权重,接着,使用这个最新的权重对第二个分类器进行训练,然后再次对训练集进行预测,继续更新权重,不断循环向前。
下面代码实现卫星数据集的例子:(再次强调,本节是基于第七节集成学习,因此卫星数据集已经存在)
m = len(X_train)

plt.figure(figsize=(11, 4))
for subplot, learning_rate in ((121, 1), (122, 0.5)):
    sample_weights = np.ones(m)
    plt.subplot(subplot)
    for i in range(5):
        svm_clf = SVC(kernel="rbf", C=0.05, gamma="auto", random_state=42)
        svm_clf.fit(X_train, y_train, sample_weight=sample_weights)
        y_pred = svm_clf.predict(X_train)
        sample_weights[y_pred != y_train] *= (1 + learning_rate)
        plot_decision_boundary(svm_clf, X, y, alpha=0.2)
        plt.title("learning_rate = {}".format(learning_rate), fontsize=16)
    if subplot == 121:
        plt.text(-0.7, -0.65, "1", fontsize=14)
        plt.text(-0.6, -0.10, "2", fontsize=14)
        plt.text(-0.5,  0.10, "3", fontsize=14)
        plt.text(-0.4,  0.55, "4", fontsize=14)
        plt.text(-0.3,  0.90, "5", fontsize=14)

plt.show()
运行结果如下:
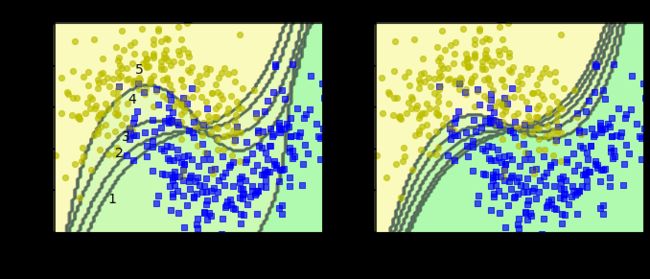
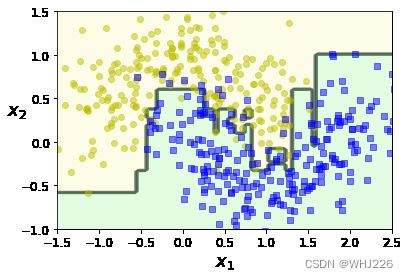
图中显示了在卫星数据集上5个连续的预测器的决策边界(每个预测器都是使用RBF核函数高度正则化的SVM分类器) 。第一个分类器产生了许多错误实例,所以这些实例的权重得到提升。因此第二个分类器在这些实例上的表现有所提升,然后第三个,第四个······ 右图绘制的是相同预测器序列,唯一的差别在于学习率减半(即每次迭代仅提升一半错误分类的实例的权重)。
这种依序学习技术有一个重要的缺陷就是无法并行,因为每个预测器只能在前一个预测器的训练完成并评估之后才能开始训练。
下面,我们来看一下 AdaBoost 算法。每个实例的权重 ![]() 最初设置为
最初设置为 ![]() 。第一个预测器训练后,计算其加权误差率
。第一个预测器训练后,计算其加权误差率 ![]() , 公式如下:
, 公式如下:
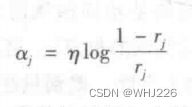
预测器的权重 ![]() 通过下面的公式计算,其中
通过下面的公式计算,其中 ![]() 是学习率超参数(默认为1)。预测器的准确率越高,其权重越高。
是学习率超参数(默认为1)。预测器的准确率越高,其权重越高。
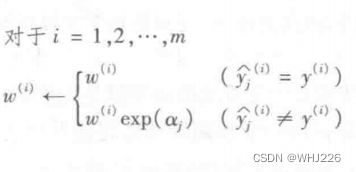
下面的公式对实例的权重进行更新,提升被错误分类的实例的权重。
然后将所有实例的权重归一化(除以 ) 。最后,使用更新后的权重训练一个新的预测器,重复该过程,直到完美的预测器出现,算法停止。
预测的时候,AdaBoost 就是简单地计算所有预测器的预测结果,并使用预测器的权重 ![]() 对它们进行加权。最后,得到大多数加权投票的类别就是预测器给出的预测类别。
对它们进行加权。最后,得到大多数加权投票的类别就是预测器给出的预测类别。
下面的代码使用Scikit-Learn 的 AdaBoostClassifier 训练了一个 AdaBoost 分类器,它基于200个单层决策树。单层决策树就是 max_depth=1 的决策树,就是一个决策节点加两个叶节点。
from sklearn.ensemble import AdaBoostClassifier

ada_clf = AdaBoostClassifier(
    DecisionTreeClassifier(max_depth=1), n_estimators=200,
    algorithm="SAMME.R", learning_rate=0.5, random_state=42)
ada_clf.fit(X_train, y_train)

plot_decision_boundary(ada_clf, X, y)
运行结果如下:
4.2 梯度提升
与 AdaBoost 一样,梯度提升也是逐步在集成中添加预测器,每一个都对前序做出改正。不同之处在于,它不是像 AdaBoost 那样在每个迭代中调整实例权重,而是让新的预测器针对前一个预测器的残差进行拟合。
我们来看一个简单的回归示例,使用决策树作为基础预测器,这种称为梯度树提升或者是梯度提升回归树。首先,我们在训练集上拟合一个 DecisionTreeRegressor :
带噪声的二次训练集:
np.random.seed(42)
X = np.random.rand(100, 1) - 0.5
y = 3*X[:, 0]**2 + 0.05 * np.random.randn(100)
from sklearn.tree import DecisionTreeRegressor
tree_reg1 = DecisionTreeRegressor(max_depth=2, random_state=42)
tree_reg1.fit(X, y)针对第一个预测器的残差,训练第二个 DecisionTreeRegressor :
y2 = y - tree_reg1.predict(X)
tree_reg2 = DecisionTreeRegressor(max_depth=2, random_state=42)
tree_reg2.fit(X, y2)
针对第二个预测器的残差,训练第三个 DecisionTreeRegressor :
y3 = y2 - tree_reg2.predict(X)
tree_reg3 = DecisionTreeRegressor(max_depth=2, random_state=42)
tree_reg3.fit(X, y3)
现在我们就有了一个包含三棵树的集成,它将所有树的预测相加,从而对新实例进行预测:
X_new = np.array([[0.8]])
y_pred = sum(tree.predict(X_new) for tree in (tree_reg1, tree_reg2, tree_reg3))
y_pred
运行结果如下:
array([0.75026781])下面我们可视化进行分析:
def plot_predictions(regressors, X, y, axes, label=None, style="r-", data_style="b.", data_label=None):
    x1 = np.linspace(axes[0], axes[1], 500)
    y_pred = sum(regressor.predict(x1.reshape(-1, 1)) for regressor in regressors)
    plt.plot(X[:, 0], y, data_style, label=data_label)
    plt.plot(x1, y_pred, style, linewidth=2, label=label)
    if label or data_label:
        plt.legend(loc="upper center", fontsize=16)
    plt.axis(axes)

plt.figure(figsize=(11,11))

plt.subplot(321)
plot_predictions([tree_reg1], X, y, axes=[-0.5, 0.5, -0.1, 0.8], label="$h_1(x_1)$", style="g-", data_label="Training set")
plt.ylabel("$y$", fontsize=16, rotation=0)
plt.title("Residuals and tree predictions", fontsize=16)

plt.subplot(322)
plot_predictions([tree_reg1], X, y, axes=[-0.5, 0.5, -0.1, 0.8], label="$h(x_1) = h_1(x_1)$", data_label="Training set")
plt.ylabel("$y$", fontsize=16, rotation=0)
plt.title("Ensemble predictions", fontsize=16)

plt.subplot(323)
plot_predictions([tree_reg2], X, y2, axes=[-0.5, 0.5, -0.5, 0.5], label="$h_2(x_1)$", style="g-", data_style="k+", data_label="Residuals")
plt.ylabel("$y - h_1(x_1)$", fontsize=16)

plt.subplot(324)
plot_predictions([tree_reg1, tree_reg2], X, y, axes=[-0.5, 0.5, -0.1, 0.8], label="$h(x_1) = h_1(x_1) + h_2(x_1)$")
plt.ylabel("$y$", fontsize=16, rotation=0)

plt.subplot(325)
plot_predictions([tree_reg3], X, y3, axes=[-0.5, 0.5, -0.5, 0.5], label="$h_3(x_1)$", style="g-", data_style="k+")
plt.ylabel("$y - h_1(x_1) - h_2(x_1)$", fontsize=16)
plt.xlabel("$x_1$", fontsize=16)

plt.subplot(326)
plot_predictions([tree_reg1, tree_reg2, tree_reg3], X, y, axes=[-0.5, 0.5, -0.1, 0.8], label="$h(x_1) = h_1(x_1) + h_2(x_1) + h_3(x_1)$")
plt.xlabel("$x_1$", fontsize=16)
plt.ylabel("$y$", fontsize=16, rotation=0)

plt.show()
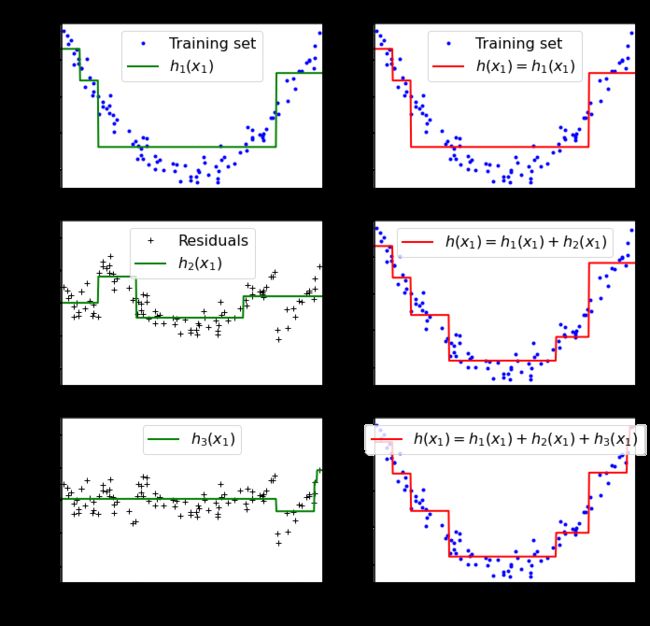
运行结果如下:
上图中,左侧表示这三棵树单独的预测,右侧表示集成的预测。第一行,集成只有一棵树,所以它的预测与第一棵树的预测完全相同。第二行是在第一行的残差上训练的一棵新树,右侧可见,集成的预测等于前面两棵树的预测之和。
训练梯度提升回归树集成有个简单的方法,就是使用 Scikit-Learn 的 GradientBoostingRegressor 类。与 RandomForestRegressor 类似,它具有控制决策树生长的超参数以及控制集成训练的超参数。下面的代码可以创建上面的集成:
from sklearn.ensemble import GradientBoostingRegressor

gbrt = GradientBoostingRegressor(max_depth=2, n_estimators=3, learning_rate=1.0, random_state=42)
gbrt.fit(X, y)

gbrt_slow = GradientBoostingRegressor(max_depth=2, n_estimators=200, learning_rate=0.1, random_state=42)
gbrt_slow.fit(X, y)

plt.figure(figsize=(11,4))

plt.subplot(121)
plot_predictions([gbrt], X, y, axes=[-0.5, 0.5, -0.1, 0.8], label="Ensemble predictions")
plt.title("learning_rate={}, n_estimators={}".format(gbrt.learning_rate, gbrt.n_estimators), fontsize=14)

plt.subplot(122)
plot_predictions([gbrt_slow], X, y, axes=[-0.5, 0.5, -0.1, 0.8])
plt.title("learning_rate={}, n_estimators={}".format(gbrt_slow.learning_rate, gbrt_slow.n_estimators), fontsize=14)

plt.show()
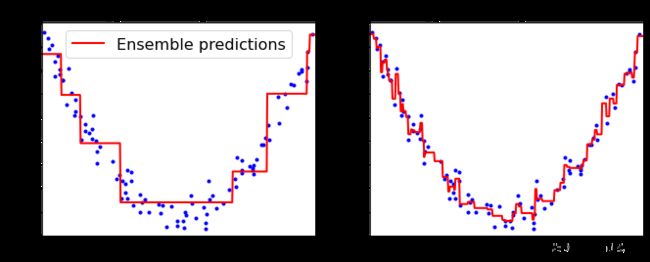
运行结果如下:
上图显示了低学习率的两个集成:左侧拟合训练集的树数量不足,右侧拟合训练集的树数量过度而导致过度拟合。超参数 learning_rate 对每棵树的贡献进行缩放。如果我们设置为低值,如0.1,那么就需要更多的树来拟合训练集,但是预测的泛化效果更好,这也是一种被称为收缩的正则化技术。
要找到树的最佳数量,我们可以使用早期停止法。简单的实现方法就是使用 staged_predict() 方法:它在训练的每个阶段都对集成的预测返回一个迭代器。
以下代码训练了一个拥有120棵树的梯度提升回归树集成,然后测量每个训练阶段的验证误差,从而找到树的最优数量,最后使用最优树重新训练一个梯度提升回归树集成:
import numpy as np
from sklearn.model_selection import train_test_split
from sklearn.metrics import mean_squared_error

X_train, X_val, y_train, y_val = train_test_split(X, y, random_state=49)

gbrt = GradientBoostingRegressor(max_depth=2, n_estimators=120, random_state=42)
gbrt.fit(X_train, y_train)

errors = [mean_squared_error(y_val, y_pred)
          for y_pred in gbrt.staged_predict(X_val)]
bst_n_estimators = np.argmin(errors) + 1

gbrt_best = GradientBoostingRegressor(max_depth=2,n_estimators=bst_n_estimators, random_state=42)
gbrt_best.fit(X_train, y_train)

min_error = np.min(errors)

plt.figure(figsize=(11, 4))

plt.subplot(121)
plt.plot(errors, "b.-")
plt.plot([bst_n_estimators, bst_n_estimators], [0, min_error], "k--")
plt.plot([0, 120], [min_error, min_error], "k--")
plt.plot(bst_n_estimators, min_error, "ko")
plt.text(bst_n_estimators, min_error*1.2, "Minimum", ha="center", fontsize=14)
plt.axis([0, 120, 0, 0.01])
plt.xlabel("Number of trees")
plt.title("Validation error", fontsize=14)

plt.subplot(122)
plot_predictions([gbrt_best], X, y, axes=[-0.5, 0.5, -0.1, 0.8])
plt.title("Best model (%d trees)" % bst_n_estimators, fontsize=14)

plt.show()
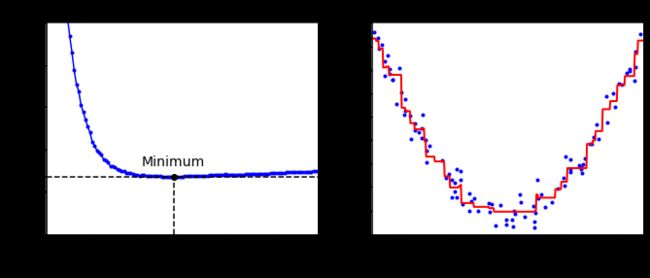
运行结果如下:
左图是验证误差,右图是最后的预测模型。
学习笔记——《机器学习实战:基于Scikit-Learn和TensorFlow》
