Overview of iOS Crash Reporting Tools: Part 1/2
Believe it or not, developers are not perfect, and every once in a while you might have a (gasp!) bug in your app.
You will try your best to ship your apps with no bugs in them, but more often than not you realise afterwards that a bug has slipped through the net. Sometimes such bugs result in crashes, which no user likes to encounter.
Never fear though, for there are many excellent iOS crash reporting tools to help you out! They can detect crashes and log details so you can investigate later, and even send you an email summary of when crashes occur and how often.
However, you may wonder which of these tools is the best? Read on to find out!
Introduction
You’ve spent months working on your newest application, you’ve spent weeks beta testing it, you’ve published it on the App Store, and the positive reviews are starting to roll in. Everything looks great!
But then one user posts a one-star review noting the worst thing possible — the app crashed. Yikes! Nothing is worse than hearing about crashes from the user community.
Although it’s nearly impossible to test for every possible scenario, you can make the triage and troubleshooting portion of your job a little easier by using crash reporting tools in your apps. In fact, they are possibly the most important tool you can make use of to improve your application. Even if you test it thoroughly before the submission to the store, chances are you may have forgotten to check a particular sequence or scenario which leads to a crash.
From a user perspective, a crash is more than just an annoyance. When the application just stops working without any feedback, this often results in lost data and unhappy users. Installing a crash reporting system in your app allows you to obtain all the information you need to be able to fix these annoyances.
When it comes to troubleshooting, the more information that is collected — such as the OS version, the device type, and the application version — the more details you have to track down the source of the bug and fix it. That way, you can turn each crash incident into an opportunity to improve your app!
In this two-part series, you’ll get an overview of the different options of crash reporting tools available to developers. You’ll learn about various free and commercial tools, as well as the various pros and cons of each tool. By the end of the first part, you’ll be able to make an informed choice as to the best tool for your needs. In the second part, you will learn how to get started with each crash reporting service and tie it into your app.
Sound good? Then let’s take a behind-the-scenes look at what goes into a crash reporting tool.
Crash Reporting Basics
A crash reporting tool is actually a combination of two components: a reporting library and a server-side collector. You can think of these items in terms of a restaurant: the reporting library is the kitchen and the collector is the waiter. The developer — i.e. you — plays the part the customer.
You can have the best organized kitchen in the world, but you’ll never eat anything if there isn’t a waiter to bring food to the table. Likewise, your waiter can provide excellent service, but if the food is not well prepared, your experience will not be a good one!
As a great restaurant should include a great kitchen and great waiters, a crash reporting tool should include a great reporting library and a great server-side collector. The role of the reporting library is to prepare the details about a crash. The role of the server-side component is to collect the crash data and present it in a meaningful way.
Symbolication
In iOS crash reporting, there’s one more thing that’s crucial to understanding your crash reports – symbolication. But what is symbolication? You can think of symbolication as the chef in the kitchen, who transforms raw ingredients like bananas, ice cream and rum into something meaningful and tasty such asBananas Foster.
A crash report contains a stack trace of every thread that was running when the application terminated. This trace is similar to the traces you see in the debugger when paused, although a debugger’s trace will include both instance names and methods (often referred as symbols). In comparison, when an app is built for release, usually these symbol names are stripped from the binary. This means that crash reports coming into your crash reporter service contain strange looking hexadecimal addresses instead of symbol names.
You will no doubt have at least one crash log on your device, so to see what these hexadecimal addresses look like, find such a log like this:
- Connect your device to your Mac.
- Start Xcode and open the Organizer (CMD+Shift+2).
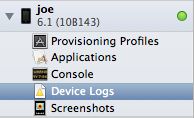
- Find your device on the left and select the “Device Logs” item as shown in the screenshot below:
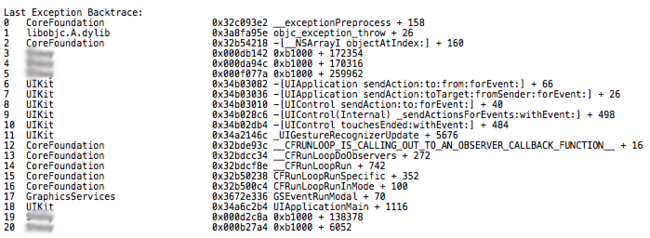
A list of crash reports will show up, unless your device is brand new and you haven’t used it much. Select one application, and have a look to the right. You should see text displayed similar to the following:
Notice how there are some symbols, for example -[__NSArrayI objectAtIndex:], and some hexadecimal addresses, for example 0x000db142 0xb1000 + 172354. This is what is known as a partially symbolicated crash log. The top of the stack trace is where the crash occurred, and going down the list indicates which other methods were called to get to where the crash occurred.
The reason that it’s a “partly” symbolicated log is because Xcode is able to symbolicate just the system components like UIKit and CoreFoundation (lines 6 to 18 in the screenshot above). But crashes aren’t usually generated by system libraries, instead they have their roots in the code you write. For example, line 2 indicates that the code path that lead to the crash went through the objectAtIndex: method on NSArray.
However, take a look at line 3 in the screenshot above. What’s the meaning of this?
0x000db142 0xb1000 + 172354 |
This is an example of an un-symbolicated portion of the log. All this tells us is that the crash occurred at the instruction at memory address 0x000db142 which is equal to 0xb1000 + 172354. The reason for it telling us that seemingly obscure bit of math is that 0xb1000 is the start address of the main portion of the app. The 172354 is the important bit as it is the offset into the app.
Note: All these numbers relate to byte offsets within the memory addressable to the CPU. When an application is run, the binary is loaded into memory and read instruction by instruction, by the CPU. The offset where the program is loaded, in this case 0xb1000, is randomised as a minimal form of security against exploits.
But, that’s not terribly useful for debugging purposes. A raw crash report contains what you need to understand the cause of the crash, but you can’t fully comprehend it unless you dive a little deeper and match it up with the source code through a process known as “symbolication”. This is the process of turning these raw numbers into symbols and even pinpointing the exact line of code.
The Symbolication Process
In the case of iOS, this requires two things. The first is the exact application binary that caused the crash. The second is the dSYM file created during the compilation of the binary.
How do you get a hold of these two items? Well, if you are using the “Build and Archive” command in Xcode then you are already storing them! In Xcode, you can see these in the “Organizer” window. To see for yourself, open Xcode then go to Window\Organizer. Then select the “Archives” tab where you will see a list of your apps on the left and on the right you’ll see a list of the archives for the selected app.
However, if you haven’t been using “Build and Archive”, or don’t have any applications to choose from, simply create a dummy app to see where Xcode stores these files.
Note: If you’re familiar with the Organizer, feel free to skip this section and move on to the section titled “Find that dSYM!”
To create a dummy app. Start up Xcode, go to File\New\New Project, choose the iOS\Application\Empty Application template, and click Next, as shown in the screenshot below:
On the next page, feel free to put in any name for the application. The details don’t matter because this is just a throwaway app to create an archive with a binary and dSYM in it. Click Next, then choose a location to save your project. When Xcode presents the workspace, select iOS Device as the compilation target, as shown below:
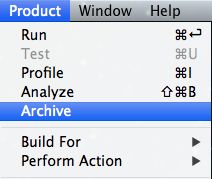
Finally, select Product\Archive, as shown below:
This will generate an archive for your application, which can then be found in the Organizer.
Find that dSYM!
Go to the Organizer, by selecting Window\Organizer, select the Archives tab and then find either an archive for one of your own apps or the test app you made if you followed the previous section. In case you’re struggling to find the archive, here’s a screenshot of what the Organizer looks like:
Right-click on your choice of archive, and choose Show in finder. This will open up a Finder window with a file whose extension is .xcarchive. This is not a file, per se, but rather a folder.
Note:Just like archives, lots of “files” on Mac OS X and iOS are actually folders. Examples include applications (.app), iPhoto libraries (.photolibrary) and code frameworks (.framework).
To inspect the archive, first open a new terminal window. To open a terminal window, open a new Finder window, navigate to your Applications folder, then navigate to the Utilities subfolder, and finally run the Terminal application. Or you could simply type “terminal” into Spotlight and press return when it’s found Terminal. :]
Once Terminal is open, drag the .xcarchive file into the terminal window and you’ll see the complete path to the folder. Press Control-A to jump to the start of the path and type: "cd " (note that there is a space after the “cd”).
Next, press enter. You’ll notice that the terminal prompt (the bit before where the cursor sits) now has the name of the .xcarchive before the dollar sign.
Next, type the following command: "find . -type d". You should see some output similar to the following:
$ find . -type d . ./Products ./Products/Applications ./Products/Applications/breezi.app ./Products/Applications/breezi.app/_CodeSignature ./Products/Applications/breezi.app/en.lproj ./dSYMs ./dSYMs/breezi.app.dSYM ./dSYMs/breezi.app.dSYM/Contents ./dSYMs/breezi.app.dSYM/Contents/Resources ./dSYMs/breezi.app.dSYM/Contents/Resources/DWARF |
The command you just typed is using the “find” program, which does exactly what it sounds like – it finds things! The “.” means “search in the current directory” and the “-type d” means “find things that are directories”. In the resulting list of files, notice the .dSYM directory, along with the .app directory. Those are what you’ll need to finish the symbolication process and tie the crash report to your code.
It’s the .dSYM that’s really the most important bit. Recall from earlier that a release build has all the symbols stripped from the binary, which is why crash reports from release builds contain only hexadecimal addresses. The .dSYM contains all the information required to convert back into symbols through the process of symbolication.
Xcode has a method of symbolication built into it and it’ll generally do a good job of making sure any crash log you ever see has been symbolicated. It uses spotlight to find the appropriate .dSYM file for the crash log in question, but sometimes it can’t find it (maybe because you didn’t have it on your computer at the time as the build was made on a build server). In these cases, you can force Xcode to re-symbolicate once you have the .dSYM copied to your computer. To force Xcode to re-symbolicate a crash you can do so in the Organizer. Go to the Organizer again, select the “Devices” tab and then select “Device Logs” on the left. Then select the crash log that needs re-symbolicating and press the button at the bottom of the screen:
It’s not just Xcode that uses the .dSYM to symbolicate crash reports. It’s also required by crash reporting tools. As you’ll see throughout the reviews of the various crash reporting tools, the way you get this file to the crash reporting tool is different, but it’s always required for symbolication. There’s no point having crash logs if you can’t read them after all!
Making a Case for Crash Reporting
It’s an incredibly clunky process to collect crash logs manually and since a user will probably not have Xcode installed, they would have to use iTunes to access the crash logs. While not a technique I recommend asking your users to do, here’s how you’d do it in the absence of crash reporting tools:
- Connect the device to the Mac, synch it via iTunes and navigate to the logs folder, which is different on each operating system:
- OS X: ~/Library/Logs/CrashReporter/MobileDevice/(your iPhone’s name)/(your app name)
- Windows XP: C:\Documents and Settings\Application Data\Apple computer\Logs\CrashReporter\(your iPhone’s name)\(your app name)
- Windows Vista: C:\Users\AppData\Roaming\Apple computer\Logs\CrashReporter\MobileDevice\(your iPhone’s name)\(your app name)
- Look for files with the extension of “.crash”.
- Ask the user to send those files to you.
- Once you have the files, open the Organizer in Xcode and select “Device Logs” on the top left, as shown below:
- At the bottom select import to add the log to Xcode and, if necessary because Xcode hasn’t noticed the log yet, trigger a re-symbolication as explained earlier.
Phew! Can you imagine any user volunteering to do this for you?
This solution is pretty tedious, to say the least, and it requires the active involvement of your users. That might be OK when you’re in the beta testing phase, and your testers expect a bit of weirdness with the app. However, once you’re in production don’t expect that your users will be happy to go through all that work to give you a crash report!
Interestingly enough, Apple helps out and collects crash reports for applications that are published through the App Store. However, it only happens for users who opted to automatically send diagnostic data to Apple. If you have an app available through, the App Store login to iTunes Connect, select “Manage Your Applications”, choose one of your applications and the click the blue button “View details”, as shown below:
This will open a detailed view of your app’s properties. At the top right there is a button “Crash Reports”, as shown in the following screenshot:
This section will contain the crash logs collected by Apple. In my experience, these aren’t collected as frequently as with other crash reporting tools, probably because not all that many people have automatic sending of diagnostic reports turned on. Plus, they still require some manual work from developers, like importing and symbolicating.
The smart developer, who would rather spend time writing code than manually retrieving and symbolicating crash dumps, would prefer a process like this:
- Release an application (either in beta or in production) which is able to capture and store crash logs.
- The application periodically (or even immediately!) sends crash reports to a server which collects and organizes them for you.
- The developer logs in to the server, finds the crash reports already symbolicated, and can easily find the root cause of the issue.
It’s not a far-fetched dream — tools like this do exist in the real world! However, there are quite a few to choose from. Some are free and open source, while others are commercial products. Of the many available, I’ve reviewed some of the most prominent offerings:
- Crashlytics
- Crittercism
- Bugsense
- TestFlight
- HockeyApp
Have a read through the reviews to see which one provides the particular solutions you’re looking for in your app. I have my own favorites, but I’d love to hear your thoughts on your personal choices in the comments section!
Crashlytics
Recently bought by Twitter, Crashlytics is pretty famous in the iOS community. It’s used by well-known companies such as Path and Yammer. It is a full-stack service, meaning that the framework provides both client-side and server-side parts. At the moment, Crashlytics supports only iOS, although the website does indicate that Android support is coming soon.
Crashlytics Setup and Dashboard
Once you have logged into the Crashlytics site, you’ll be prompted to download a Mac application. This application will guide you through the process of configuring your iOS application to work with the Crashlytics service. The application works like a wizard. It first asks you to pick an Xcode project on your disk. Next, it will install the Crashlytics framework, and finally, it will add a step to the building phase of your project.
Any crashes captured will appear on the Crashlytics back-end. Just login, select the application you’re interested in, and you’ll see something like this:
The data is definitely well-organized. At a glance, you can see the issues reported, number of crashes, and the number of users affected. On the right, a graph shows the distribution of crashes over time. Each crash is classified by application version to avoid any confusion.
Crashlytics Reports
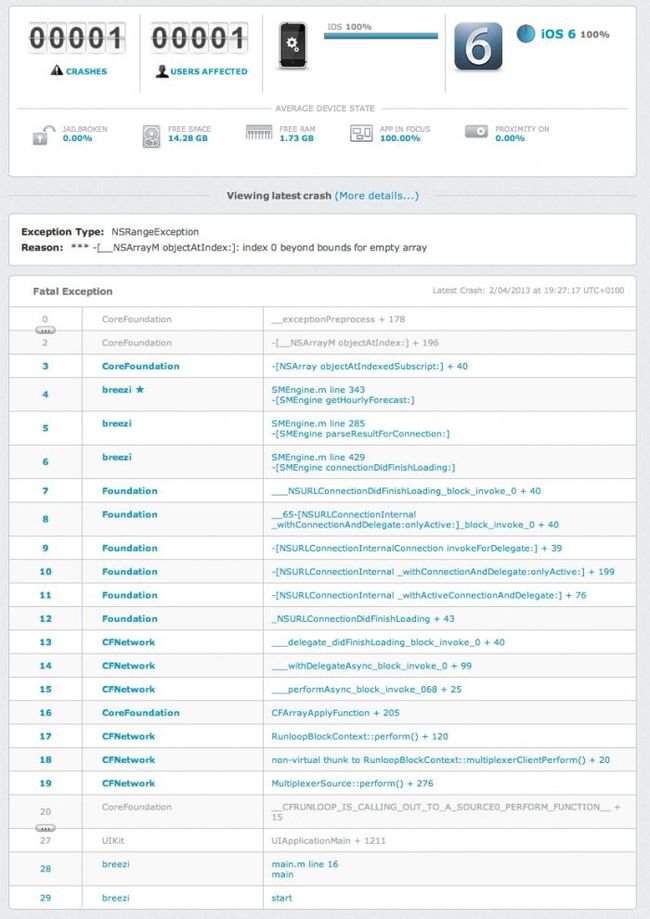
Crashlytics displays the list of crashes at the bottom, already symbolicated, and you can immediately see the line generating the crash. In the example above, you can quickly see that line 343 in SMEngine.m was where the crash occurred.
If you click on a crash entry, further details are displayed, as shown in the screenshot below:
At the top of the report, there are contextual details about the average environment where the crash occurred, like the free space on the device, which is handy if you are caching data on disk; RAM, which is handy if you are caching data in memory; and whether the device is jailbroken, along with other juicy details.
At the bottom, you’ll see a stack trace with the sequence of calls that occurred right before the app crashed. As noted, it is very likely some of your code is causing the crash, so you should look for the names of your classes and methods. In this example, the crash is in getHourlyForecast, which is called byparseResultForConnection, which in turn is called by connectionDidFinishLoading.
Once you have fixed the bug and deployed the new version of the app, you can mark the issue as closed, using the control shown below:
Once an issue is closed, it won’t appear again in the list of crashes that require your attention.
Crashlytics 3rd Party Integration
You can integrate Crashlytics with third party bug trackers and project management tools, including the following:
Simply enter your credentials for the above services, and Crashlytics servers will forward crash log data to the appropriate service. Cool! :]
For those developers who love to craft their own solution, you can even set up a web hook. This is a custom URL where Crashlytics will send you data in JSON format, and you’re then free to manipulate the data as you like.
The logging functions that Crashlytics provides are worth mentioning as well. Once you have configured your project for Crashlytics, you can quickly set up a macro to log events, actions and most importantly, the values of variables, which can be helpful while hunting for the source of a crash.
This is the equivalent of using NSLog statements, except instead of logging to the console, the lines are sent to Crashlytics. How many times have you wished you could see the console output as your customers use your app in the real world? That’s a reality now! :]
You can also set up notifications via email to receive messages about crashes either as they are received, or as a daily email digest.
Crashlytics Usage Tiers
Previously, Crashlytics had two usage tiers: a free tier, as well as a paid enterprise tier. However, the enterprise tier is now free as well. Thanks Twitter!
To go back to the restaurant analogy, Crashlytics is a good restaurant with a proficient kitchen (symbolication). The food is good and the wait staff are attentive (browsability and usability of logs on the server). Unfortunately, there is not much variety in the menu (just iOS). There is also a wait list, much like a very good restaurant, which means you may have to wait to be seated. However the wait time at the moment doesn’t appear to be very long and you are often seated within minutes.
Crittercism
Crittercism is another full-stack tool to keep track of your crash logs. It has been adopted by companies such as Netflix, Eventbrite and Linkedin. It provides support for iOS, as well as Android, HTML5 and Windows 8 (which is in beta at the moment).
Crittercism Setup and Dashboard
Setup is pretty simple. You create an account, create an application on the server, download an SDK, add it to your project, and initialize it. Then you’re ready to rock!
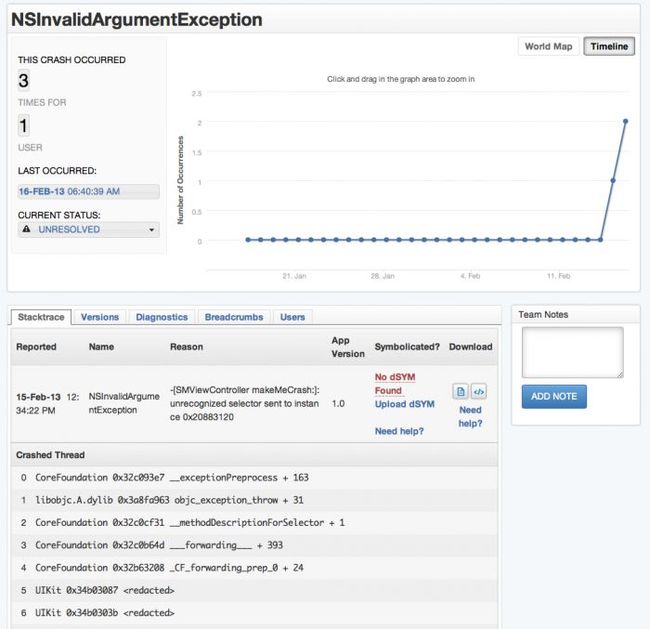
The screenshot below shows the dashboard view of Crittercism, along with a symbolicated crash log:
With Crittercism, not every detail is available at first glance. For example, to view the application version or contextual data, you have to navigate through the tabbed menu in the middle of the page.
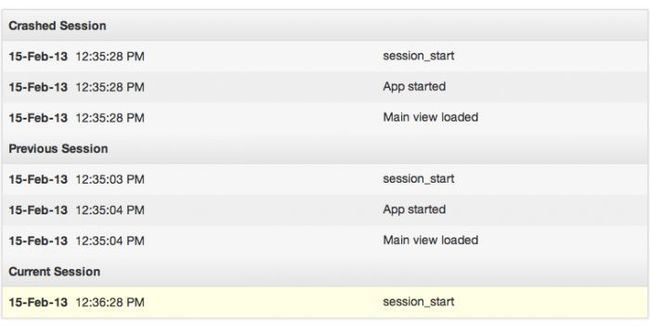
The “breadcrumbs” feature of Crittercism allows you to place log statements throughout your code to get contextual information about what happened before the crash, as shown below:
Note: Breadcrumbs is a paid enterprise feature of Crittercism, but it’s included in the trial period if you want to get a feel for how it works.
Like other tools, you can mark a crash log as “known” or “solved”. Finally, the SDK includes the possibility to schedule a “Rate My App” popup via the backend, with the ability to customize when the popup appears, as well as the message displayed.
Crittercism Incident Mapping
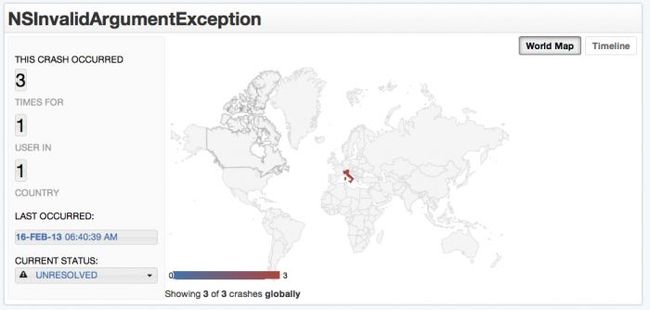
Another interesting feature of Crittercism is the map that shows you where your logs were recorded, as shown below:
Personally, I have some concern about this, since the user is never asked for permission to calculate a user’s current position. You can use your own judgment call on this.
You can receive email notifications when a crash log is uploaded to the server, and you can set up alarms to receive SMS or email messages when crash counts pass a given threshold.
Crittercism 3rd Party Integration
As far as third party integration goes, you can hook Crittercism up to HelpShift or Uservoice. Both are customer support help-desk applications.
Crittercism Pricing Tiers
There are different tiers for pricing for Crittercism, based on whether you’re making consumer or enterprise apps. For full details, check out their pricing page.
When you sign up, you are offered a 30-day free trial which includes enterprise level features like breadcrumbs and phone support.
Crittercism is an interesting restaurant. The menu is very rich (offering iOS, Android, HTML5 and Windows 8 in beta) but the wait staff is not really friendly (requiring manual upload of dSYM files, and the usability of the website isn’t the best).
Bugsense
Bugsense is another full-stack service, used by big companies such as Samsung, Intel and Groupon. It supports iOS, Android, Windows 8, Windows Phone and HTML5.
Bugsense Setup and Dashboard
The setup is pretty similar to other platforms: create an account, create an application, download an SDK, include it in your project, and set the API key.
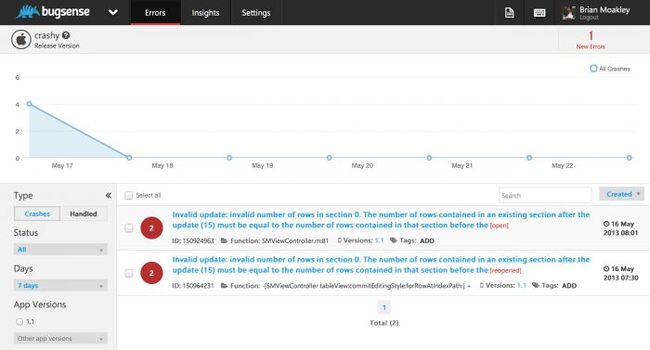
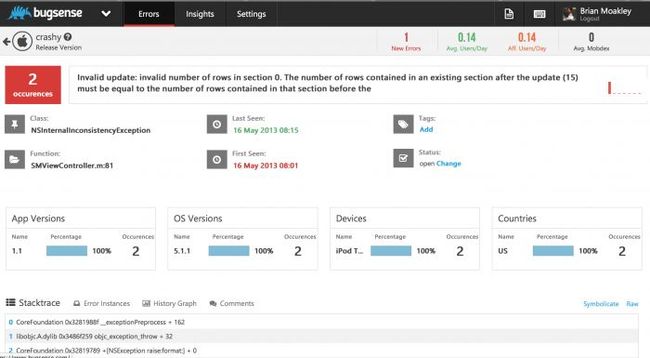
The Bugsense dashboard for an application looks like this:
If you click one of the logs, you are presented with a detailed view, like so:
You can see the class that caused the crash — in this case, NSInvalidArgumentException — the function generating it, and the corresponding line of code (SMViewController.m:26).
Bugsense Crash Reports
The log presentation is chock-full of detail, and the user interface allows the ability to customize which attributes are displayed. It also displays the number of times a crash has occurred. As usual, you can mark issues as resolved.
One of the downsides of Bugsense is that you have to manually upload the dSYM file of your build to allow symbolication on the server-side. You can configure the app to run symbolication right on the device, although the documentation discourages it because you don’t actually get full information such as code line numbers.
To keep track of the application’s context during run-time, you can drop breadcrumbs into your code at key points and they will be uploaded to the server, together with data about the crash. You can also use events to perform this functionality, but they still look pretty similar to breadcrumbs.
Bugsense Push Notifications
An interesting feature is “Fix notifications”. This feature allows you to send your users a push notification to indicate that an upgrade is available for the app. This is pretty handy when you have resolved a bug and released a new version, but some of your users is still running an old version.
Bugsense 3rd Party Integration
The backend of Bugsense can be integrated with JIRA to push data about crash logs. Like other tools, you will receive email notifications when the platform receives a crash log.
Bugsense Usage Tiers
There are four pricing tiers for Bugsense as shown below:
Bugsense is a very nice restaurant. The menu is really varied (iOS, Android, Windows 8, Windows Phone and HTML5) and well organized. The wait staff is not always impeccable, but given the other great features of the restaurant, it’s something you can manage to live with.
TestFlight
TestFlight was born as a tool to manage the distribution of beta releases. Over time the developers added many more features, like action logging and crash reporting. It’s like a restaurant that has a bar or a club to entertain the client before or after dinner.
TestFlight has been adopted by companies such as Adobe, Instagram and tumblr to manage over-the-air deployment, tracking and crash reporting. Both iOS and Android are supported at present.
TestFlight Setup and Dashboard
Getting started with TestFlight is similar to other crash reporting services: create an account, create an application, download and integrate the SDK, and finally, setup an application key.
On the server-side, you have to produce a build of your app, upload the .ipa file of your distribution, at which point you can ping your testers to download the new build. This can either be done directly through the TestFlight website, or through the supplied Mac app. This app also determines when Xcode’s archive process has been completed, then prompts you to upload the new build.
The dashboard on the server-side looks like this:
A handy menu on the left allows you to browse different aspects of your build like sessions, checkpoints crashes (similar to breadcrumbs), and user feedback.
TestFlight User Feedback
TestFlight provides a feedback view in your application to collect feedback from your testers. The feedback view appears to users like this:
TestFlight Crash Reports
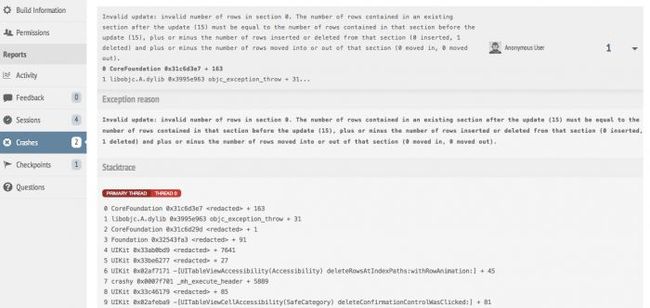
A crash log on the web server looks like this:
As noted previously, you can log when a user reaches a critical point in your app, such as opening a particular view. This provides you with contextual information which is useful when hunting for the root cause of a crash.
TestFlight 3rd Party Integration
At the moment there is no integration with third party tools, although you can hook up with the upload API to automate the upload phase.
TestFlight Usage Tiers
The TestFlight service is free at the moment; there’s no separate free or paid tiers. As for the restaurant analogy — this restaurant/bar/club is an interesting place to hang out if you want to spend the whole night in one spot. The menu is pretty limited (iOS and Android only), and the neighborhood is bit desolate (there’s no integration with third-party tools).
HockeyApp
HockeyApp is pretty well known in the indie developer world — probably because it’s made by indie developers! :]. It supports iOS, Android, MacOS, and Windows Phone. Like TestFlight, it’s a restaurant with perks, not just food. In fact, besides crash reporting and just like TestFlight, it includes distribution management.
HockeyApp Setup and Dashboard
Once you’ve created an account you are invited to create an app and download the corresponding SDK. The setup is pretty standard: import a framework, set up the API key and you are ready to go. Alternatively, you can opt for the more complicated approach of including the full source to the framework instead. This is good to know that option exists, incase you find a bug in the framework and desperately need the fix before the HockeyApp team fix it themselves. That’s a rare occurrence, but it’s good to know that the option exists!
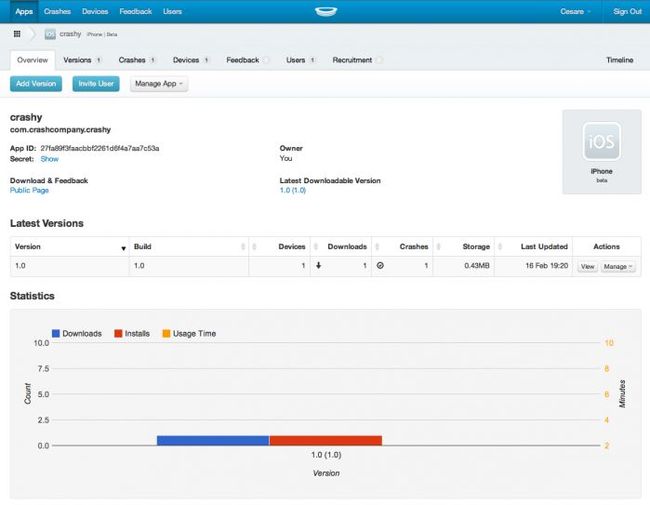
Here’s what the HockeyApp dashboard looks like:
The dashboard gives you an overview of your builds with a handy menu at the top to show different sections of the dashboard along with a nice graph of various stats at the bottom.
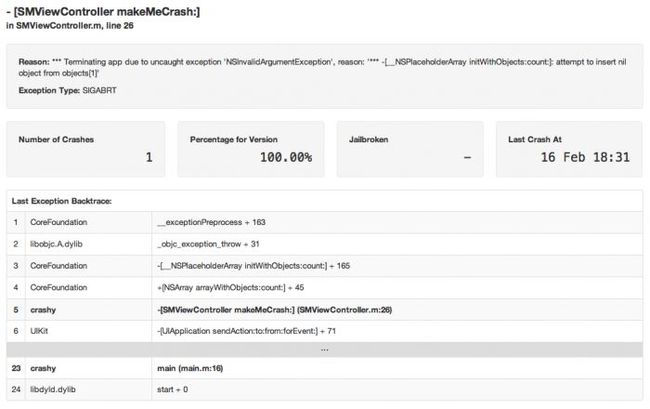
The companion desktop application detects when the archive procedure has finished and prompts you to upload the new build, including the dSYM. Once you’ve manually uploaded the dSYM file to the server, you can select the Crashes tab, pick a log and you’ll see a symbolicated crash, as below:
The HockeyApp back-end provides the ability to perform advanced searches through your logs, using criteria like “show all of the crashes that happened on iOS6 but not on an iPad”.
HockeyApp Crash Uploads
A unique feature is the ability to upload crashes you receive via email from your users. This is made possible by the fact that the HockeyApp crash log format is similar to the format adopted by Apple. You can also log events, much like using breadcrumbs, and attach them to a crash log via a simple API.
HockeyApp 3rd Party Integration
The integration with third-party tools is quite rich. HockeyApp integrates with the following tools and services, among others:
Like all other crash reporting tools, you can set the frequency and type of email notifications that you receive from HockeyApp.
HockeyApp Usage Tiers
HockeyApp boasts four pricing tiers at the moment, with discounts available if you sign up for yearly subscriptions:
It’s worth mentioning that HockeyApp is the hosted version of the open source solution Quincykit. If you’re keen on setting up your own back-end to collect logs, check out http://quincykit.net.
HockeyApp is a nice restaurant and the organization and variety of the menu is great (supporting iOS, Android, MacOS, and Windows Phone). The neighborhood (3rd party integration) is lovely and well-populated.
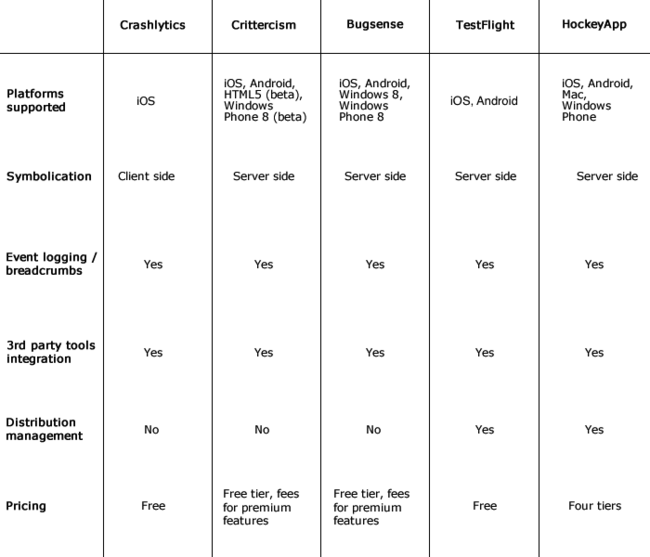
Summary and Comparison Chart
I’ve provided a table below comparing the features of the tools reviewed above:
The Bottom Line
If most of your development work is on iOS, the best crash reporting tool in my opinion is Crashlytics. It’s free, with tons of features and a very usable back-end. Moreover, the reporting process is fully automated, as you get logs on the server with no need to manually upload dSYM files for each release. One drawback is that it doesn’t manage distribution of your app.
If you’re looking for a complete service cross-platform choice, I’d suggest Bugsense, because of the usability of its dashboard. Be aware, though — the cheaper tiers only retain data for a short period, ranging from 7 to 30 days.
However, all of the services reviewed above are still valid alternatives, depending on the features and usability you’re looking for.
In the second part of this article, I will show how to get started with each of these services, integrate it with your app, and give you a tour of the various crash logs and other features.

