1. 刘二大人《PyTorch深度学习实践》线性模型 作业
- 导入库函数
import numpy as np
import matplotlib.pyplot as plt
from matplotlib import cm
from mpl_toolkits.mplot3d import Axes3D
- 设置数据集
x_data = [1.0, 2.0, 3.0]
y_data = [2.0, 4.0, 6.0]
- 定义前向传播函数
def forward(w, b, x):
    return w * x + b
- 定义损失函数
def loss(y_hat, y):
    return (y_hat - y) ** 2
- 选取 w 和 b
w_list = np.arange(0.0, 4.0, 0.1)
b_list = np.arange(-2.0, 2.1, 0.1)
- 将 w 和 b 转化为二维矩阵,并初始化mse
w, b = numpy.meshgrid(w_list, b_list)
mse = numpy.zeros(w.shape)   # 一定要注意 mse 维度要与 w 维度一致,否则画三维图时会报错
print(f'w.shape=' + str(w.shape))
print(w)
print(f'b.shape=' + str(b.shape))
print(b)
print(f'mse.shape=' + str(mse.shape))
输出结果为:
w.shape=(41, 40)
[[0.  0.1 0.2 ... 3.7 3.8 3.9]
 [0.  0.1 0.2 ... 3.7 3.8 3.9]
 [0.  0.1 0.2 ... 3.7 3.8 3.9]
 ...
 [0.  0.1 0.2 ... 3.7 3.8 3.9]
 [0.  0.1 0.2 ... 3.7 3.8 3.9]
 [0.  0.1 0.2 ... 3.7 3.8 3.9]]
b.shape=(41, 40)
[[-2.  -2.  -2.  ... -2.  -2.  -2. ]
 [-1.9 -1.9 -1.9 ... -1.9 -1.9 -1.9]
 [-1.8 -1.8 -1.8 ... -1.8 -1.8 -1.8]
 ...
 [ 1.8  1.8  1.8 ...  1.8  1.8  1.8]
 [ 1.9  1.9  1.9 ...  1.9  1.9  1.9]
 [ 2.   2.   2.  ...  2.   2.   2. ]]
mse.shape=(41, 40)
- 计算 mse
for x, y in zip(x_data, y_data):
    _y = forward(w, b, x)
    print(_y)
    mse += loss(_y, y)
mse /= len(x_data)
输出结果为:
[[-2.  -1.9 -1.8 ...  1.7  1.8  1.9]
 [-1.9 -1.8 -1.7 ...  1.8  1.9  2. ]
 [-1.8 -1.7 -1.6 ...  1.9  2.   2.1]
 ...
 [ 1.8  1.9  2.  ...  5.5  5.6  5.7]
 [ 1.9  2.   2.1 ...  5.6  5.7  5.8]
 [ 2.   2.1  2.2 ...  5.7  5.8  5.9]]
[[-2.  -1.8 -1.6 ...  5.4  5.6  5.8]
 [-1.9 -1.7 -1.5 ...  5.5  5.7  5.9]
 [-1.8 -1.6 -1.4 ...  5.6  5.8  6. ]
 ...
 [ 1.8  2.   2.2 ...  9.2  9.4  9.6]
 [ 1.9  2.1  2.3 ...  9.3  9.5  9.7]
 [ 2.   2.2  2.4 ...  9.4  9.6  9.8]]
[[-2.  -1.7 -1.4 ...  9.1  9.4  9.7]
 [-1.9 -1.6 -1.3 ...  9.2  9.5  9.8]
 [-1.8 -1.5 -1.2 ...  9.3  9.6  9.9]
 ...
 [ 1.8  2.1  2.4 ... 12.9 13.2 13.5]
 [ 1.9  2.2  2.5 ... 13.  13.3 13.6]
 [ 2.   2.3  2.6 ... 13.1 13.4 13.7]]
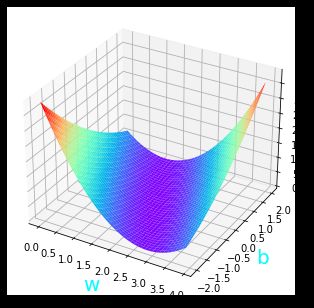
- 绘制三维曲面
h = plt.contourf(w, b, mse)

fig = plt.figure()
ax = Axes3D(fig)
plt.xlabel(r'w', fontsize=20, color='cyan')
plt.ylabel(r'b', fontsize=20, color='cyan')
ax.plot_surface(w, b, mse, rstride=1, cstride=1, cmap=plt.get_cmap('rainbow'))
plt.show()

