FigDraw 18. SCI 文章绘图之矩形树状图 (treemap)
点击关注,桓峰基因
桓峰基因公众号推出基于R语言绘图教程并配有视频在线教程,目前整理出来的教程目录如下:
FigDraw 1. SCI 文章的灵魂 之 简约优雅的图表配色FigDraw 2. SCI 文章绘图必备 R 语言基础 FigDraw 3. SCI 文章绘图必备 R 数据转换FigDraw 4. SCI 文章绘图之散点图 (Scatter)FigDraw 5. SCI 文章绘图之柱状图 (Barplot)FigDraw 6. SCI 文章绘图之箱线图 (Boxplot)
FigDraw 7. SCI 文章绘图之折线图 (Lineplot)
FigDraw 8. SCI 文章绘图之饼图 (Pieplot)
FigDraw 9. SCI 文章绘图之韦恩图 (Vennplot)
FigDraw 10. SCI 文章绘图之直方图 (HistogramPlot)
FigDraw 11. SCI 文章绘图之小提琴图 (ViolinPlot)
FigDraw 12. SCI 文章绘图之相关性矩阵图(Correlation Matrix)
FigDraw 13. SCI 文章绘图之桑葚图及文章复现(Sankey)
FigDraw 14. SCI 文章绘图之和弦图及文章复现(Chord Diagram)
FigDraw 15. SCI 文章绘图之多组学圈图(OmicCircos)
FigDraw 16. SCI 文章绘图之树形图(Dendrogram)
FigDraw 17. SCI 文章绘图之主成分绘图(pca3d)
FigDraw 18. SCI 文章绘图之矩形树状图 (treemap)
前 言
矩形树状图的故事
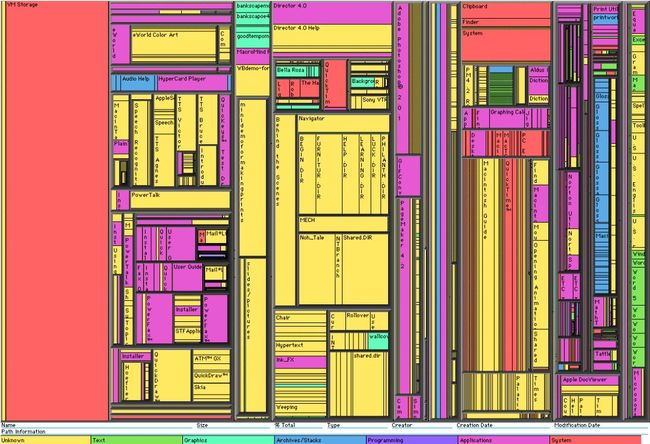
与有着悠久历史的饼图、柱形图不同,矩形树状图还很年轻。20世纪90年代初,为了找到一种有效了解计算机磁盘空间使用情况的方法,马里兰大学人机交互实验室教授 Ben Shneiderman和他的团队发明了矩形树状图,计算机磁盘空间使用情况,如图所示:
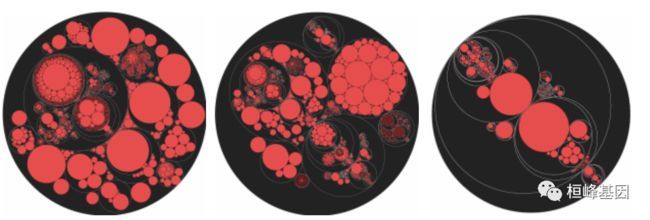
与其他变体树状图不同,如方形树状图(squarified treemap) 或缓冲树状图(cushion treemap),矩形树状图还进化成更加美观的圆堆积图(圆形树状图),如图所示:
一开始 Ben Shneiderman对这种演变的圆堆积图是不认同的。虽然圆堆积图看起来漂亮,但不及矩形树状图节省空间(因为圆圈内会有很多空白),可是它实际上比矩形树状图更能有效显示层次结构。
矩形树状图
矩形树状图,亦被称为树状结构图( treemap,rectangular tree)。
每个类别会被分配一个矩形区域,而其子类别则由嵌套在其中的小矩形代表。当不同类别被分配不同数量时,这些柱形的面积大小会与数量成正比显示:小矩形与小矩形之间(部分对部分)及小矩形与大矩形之间(部分对整体)的面积比例。此外,主类别的面积大小是其所有子类别的总如果没有数量分配给子类别,那么其面积则是主类别的总面积除以子类别的数目。因此矩形树状是一种紧凑而且节省空间的层次结构显示方式,能够直观体现同级类别之间的比较。我们也可以通过比较大小来比较类别之间的比例。矩形树状图把具有层次关系的数据可视化为一组嵌套的矩形,所有矩形的面积之和代表了整体的大小,各个小矩形的面积表示每个子数据的占比大小。所以矩形面积越大,表示子数据在整体中的占比越大。
矩形树状图的好处在于,相比传统的树形结构图,矩形树状图能更有效地利用空间,并且拥有实际占比的功能。矩形树状图的缺点在于,当分类占比太小的时候,文本会变得很难排布。相比分叉树形图,矩形树状图的树形数据结构表达得不够直观、明确。
软件安装
这里主要使用两个软件包可以实现矩形树状图的绘制,包括treemapify 和 treemap,安装如下:
if(!require(treemap))
  install.packages("treemap")
if(!require(treemapify))
  devtools::install_github("wilkox/treemapify")
数据读取
proglangs 数据
library(treemap)
library(RColorBrewer)
proglangs <- read.csv("Treemap_Data.csv ")
head(proglangs)
##                 id value     parent rank
## 1   Java (general)   423       Java   40
## 2    PHP (general)   253        PHP   39
## 3 dotNet (general)   220     dotNet   38
## 4 Python (general)   219     Python   37
## 5        AngularJS   185 JavaScript   36
## 6           Django   121     Python   35
国民收入和人口分布
GNI 2014 Data Description Gross national income (per capita) in dollars and population totals per country in 2014. Details The GNI numbers from the World Bank are based on the Atlas. The population data are taken from Natural Earth Data.
data(GNI2014)
head(GNI2014)


##   iso3          country     continent population    GNI
## 3  BMU          Bermuda North America      67837 106140
## 4  NOR           Norway        Europe    4676305 103630
## 5  QAT            Qatar          Asia     833285  92200
## 6  CHE      Switzerland        Europe    7604467  88120
## 7  MAC Macao SAR, China          Asia     559846  76270
## 8  LUX       Luxembourg        Europe     491775  75990
例子实操
1. treemapify {treemapify}
R中ggplo2包的拓展包 treemapify 可以提供 treemapify()函数将数据转换成矩形树状图,从而可以使用geom_ rect()函数绘制矩形块,用geom_text()函数添加数据标签。
library(ggplot2)
library(treemapify)

treeMapCoordinates <- treemapify(proglangs, area = "value", subgroup = "parent",
    )


Class_Label1 <- aggregate(cbind(xmin, ymin) ~ parent, treeMapCoordinates, min)
Class_Label2 <- aggregate(cbind(xmax, ymax) ~ parent, treeMapCoordinates, max)
Class_Label <- cbind(Class_Label1, Class_Label2[c("xmax", "ymax")])

treeMapCoordinates$Area <- (treeMapCoordinates$xmax - treeMapCoordinates$xmin) *
    (treeMapCoordinates$ymax - treeMapCoordinates$ymin)
treeMapCoordinates$label <- treeMapCoordinates$id

ggplot(treeMapCoordinates) + geom_rect(aes(xmin = xmin, xmax = xmax, ymin = ymin,
    ymax = ymax, fill = parent), colour = "black") + geom_text(aes(x = xmin + (xmax -
    xmin)/2, y = ymin + (ymax - ymin)/4, label = label, size = Area)) + scale_size(range = c(2,
    5)) + geom_label(aes(x = (xmin + xmax)/2, y = (ymin + ymax)/2, label = parent),
    data = Class_Label, size = 5, fill = "white", alpha = 0.5) + theme_void() + theme(legend.position = "none")
2. treemap {treemap}
treemapify() 这种方法需要的数据计算与转换相对比较复杂。所以直接使用treemap 包的 treemap()函数绘制矩形树状图,非常方便。下面举两个例子方便大家理解。
proglangs 例子
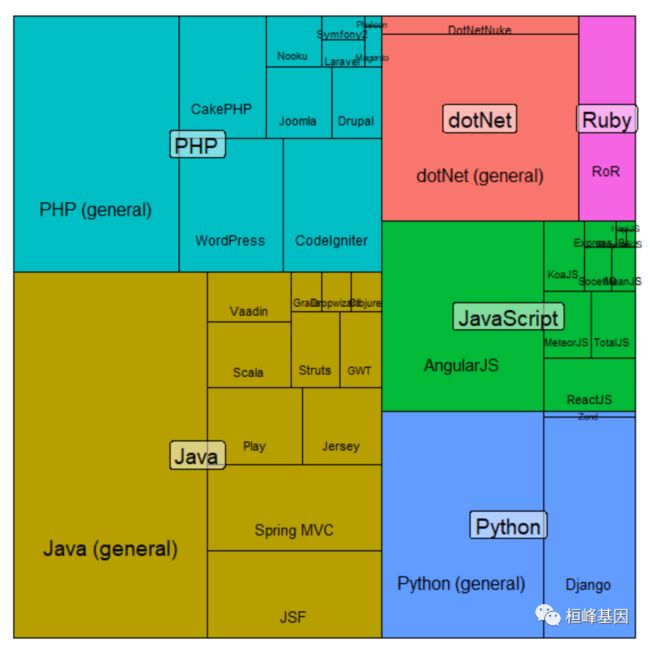
treemap(proglangs, index = c("parent", "id"), vSize = "value", vColor = "parent",
    type = "index", border.lwds = c(2, 0.1), fontcolor.labels = c("white", "grey10"),
    title = "", align.labels = list(c("center", "center"), c("right", "bottom")),
    fontsize.labels = c(12, 9), palette = "Set1")
GNI2014 例子
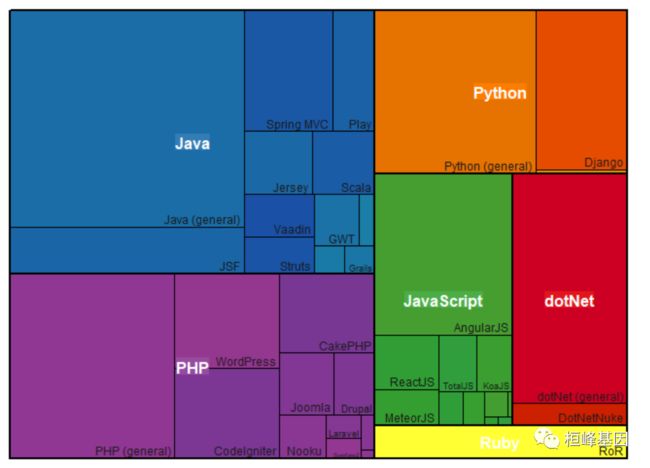
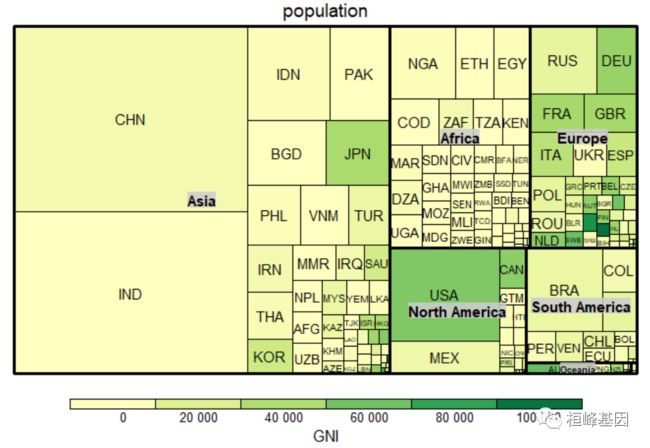
treemap(GNI2014, index = c("continent", "iso3"), vSize = "population", vColor = "GNI",
    type = "value", format.legend = list(scientific = FALSE, big.mark = " "))
总结
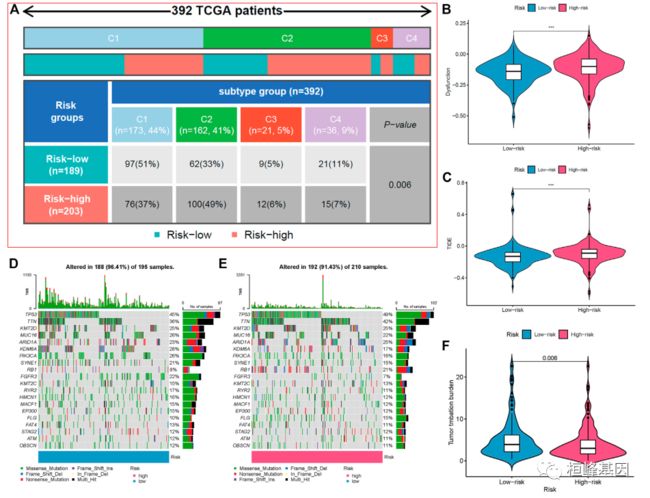
我们也可以将此类的图形放在自己的文章中,比如参考文献中的A图就是利用矩形树状图的原理分析了整个 TCGA-BC 数据集的免疫与高低风险组之间的比例关系,没有在文章中找到类似的数据,所以我们并没有复现,但是文章中的描述我们参考一下,后期可以考虑添加到自己的文章中。
The mechanism of the five lncRNAs may be related to immune response. Furthermore, type C1 (wound healing) immunization is the main immunization mode in the low-risk group, whereas type C2 [interferon-γ (IFN-γ) dominant] immunization accounts for a high proportion in the high-risk group (Figure 8A). The proportion of type C3 (inflammatory) and type C4 (lymphocyte depleted) immunization was low in the two groups. The difference of molecular typing of immune subtypes between the two risk groups was statistically significant.
软件包里面自带的例子,我这里都展示了一遍为了方便大家选择适合自己的图形,另外需要代码的将这期教程转发朋友圈,并配文“学生信,找桓峰基因,铸造成功的你!”即可获得!
桓峰基因,铸造成功的您!
有想进生信交流群的老师可以扫最后一个二维码加微信,备注“单位+姓名+目的”,有些想发广告的就免打扰吧,还得费力气把你踢出去!
References:
-
Shneiderman B, Plaisant C. Treemaps for space-constrained visualization of hierarchies[J]. 1998.
-
Bederson, B., Shneiderman, B., Wattenberg, M. (2002) Ordered and Quantum Treemaps: Making Effective Use of 2D Space to Display Hierarchies. ACM Transactions on Graphics, 21(4): 833-854.
-
Bruls, D.M., C. Huizing, J.J. van Wijk. Squarified Treemaps. In: W. de Leeuw, R. van Liere (eds.), Data Visualization 2000, Proceedings of the joint Eurographics and IEEE TCVG Symposium on Visualization, 2000, Springer, Vienna, p. 33-42.
-
Wang Y, Zhang S, Bai Y, et al. Development and Validation of Ferroptosis-Related LncRNA Biomarker in Bladder Carcinoma. Front Cell Dev Biol. 2022;10:809747. Published 2022 Mar 2. doi:10.3389/fcell.2022.809747

