基于Pycharm运行李沐老师的深度学习课程代码
最近在b站看李沐老师的深度学习课程,受益颇多。不过觉得光看视频实在是不过瘾,最好还是能实际的玩起来。鉴于我还是习惯使用pycharm,且不需要过多的中间过程展示,所以代码的编写基本都是在pycharm进行。由于李沐老师的代码主要是在Jupyter运行的,在pycharm上使用会略有差异。本篇博客以求解线性优化问题代码为例,来谈一谈在pycharm运行相关代码的一些注意事项。
教程网站:Dive into Deep Learning — Dive into Deep Learning 1.0.0-alpha0 documentation
中文网站:《动手学深度学习》 — 动手学深度学习 2.0.0-beta1 documentation
一. 安装d2l
除了安装常用的pytorch和torchvision等包以外,在运行相关代码时,会看到使用d2l包调用一些包装好的代码,如下:
import random
import torch
import numpy
from d2l import torch as d2l
这个d2l在pycharm里搜索可能搜不到。我在查阅网上其他人的介绍,通常是在Anaconda的环境中使用pip install来安装。首先我们打开anaconda虚拟环境,激活当前环境,并运行pip install d2l来运行包的安装,步骤如下:
1)使用conda info --envs列出所有的虚拟环境
2)找到你项目所在的虚拟环境,激活:activate your_envs_path
3)pip install d2l
在安装完d2l后,这时我们就可以运行代码了。
二. 结果显示
和Jupyter不同的是,在pycharm中我们不能直接使用变量名来查看数据,一般都要附加对应的打印或者显示程序才能看到对应的结果,如下:
import torch
x = torch.tensor(3.0)
y = torch.tensor(2.0)
x + y, x * y, x / y, x**y
在Jupyter中,结果就被直接显示出来了,但是在pycharm中,需要打印:
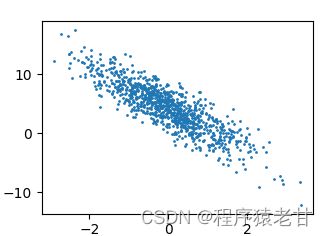
print(x+y,x*y,x/y,x**y)同理,图像显示也需要使用相应的显示代码:
d2l.set_figsize()
d2l.plt.scatter(f,l,1)
d2l.plt.show()
显示结果:
三. 代码实例
下面,我们把pycharm中验证过的完整的线性优化代码列出来,以供参考:
import random
import torch
from d2l import torch as d2l

def synthetic_data(w,b,num_examples):
    X = torch.normal(0,1,(num_examples,len(w)))
    y = torch.matmul(X,w)+b
    y += torch.normal(0, 0.1, y.shape)
    return X,y.reshape((-1,1))

def data_iter(batch_size, features, labels):
    num_examples = len(features)
    indices = list(range(num_examples))
# 这些样本是随机读取的,没有特定的顺序
    random.shuffle(indices)
    for i in range(0, num_examples, batch_size):
        batch_indices = torch.tensor(
            indices[i: min(i + batch_size, num_examples)])
        yield features[batch_indices], labels[batch_indices]

def linreg(X, w ,b):
    return torch.matmul(X ,w) + b

def squared_loss(y_hat, y):
    return (y_hat - y.reshape(y_hat.shape)) ** 2 / 2

def sgd(params, lr, batch_size):
    with torch.no_grad():
        for param in params:
            param -= lr*param.grad / batch_size
            param.grad.zero_()

true_w = torch.tensor([2, -3.4])
true_b = 4.2
features, labels = synthetic_data(true_w, true_b, 1000)
print('features:', features[0],'\nlabel:', labels[0])

a = torch.ones(3)
b = a.numpy()
f = features[:,1].numpy()
l = labels.numpy()

d2l.set_figsize()
d2l.plt.scatter(f,l,1)
d2l.plt.show()

batch_size = 10

#for X, y in data_iter(batch_size, features, labels):
#    print(X, '\n', y)

w = torch.normal(0., 0.01, size = (2,1), requires_grad= True)
b = torch.zeros(1 , requires_grad = True)
lr = 0.03
num_epochs = 10
net = linreg
loss = squared_loss

for epoch in range(num_epochs):
    for X, y in data_iter(batch_size, features, labels):
           l = loss(net(X, w, b), y) # X和y的⼩批量损失
           # 因为l形状是(batch_size,1),⽽不是⼀个标量。l中的所有元素被加到⼀起,
        # 并以此计算关于[w,b]的梯度
           l.sum().backward()
           sgd([w, b], lr, batch_size)
    with torch.no_grad():#是一个上下文管理器,被该语句 wrap 起来的部分将不会track梯度
           train_l = loss(net(features, w, b), labels)
           print(f'epoch {epoch + 1}, loss {float(train_l.mean()):f}')

print(f'w的估计误差: {true_w - w.reshape(true_w.shape)}')
print(f'b的估计误差: {true_b - b}')
如果未来发现一些新的问题,我会持续更新该博文。
2022/8/24 更新:
在学习了softmax部分内容后,我发现有一些需要注意的点,首先:
softmax章节里关于Fashion-MNIST数据集可视化的代码:
def show_images(imgs, num_rows, num_cols, titles=None, scale=1.5): #@save
     figsize = (num_cols * scale, num_rows * scale)
     _, axes = d2l.plt.subplots(num_rows, num_cols, figsize=figsize)
     axes = axes.flatten()
     for i, (ax, img) in enumerate(zip(axes, imgs)):
         if torch.is_tensor(img):
              ax.imshow(img.numpy())
         else:
              ax.imshow(img)
         ax.axes.get_xaxis().set_visible(False)
         ax.axes.get_yaxis().set_visible(False)
         if titles:
              ax.set_title(titles[i])
     d2l.plt.show()
     return axes
之前已经介绍过,要在最后添加:d2l.plt.show()。结果如下:
另外,注意下面代码:
y = torch.tensor([0, 2])
y_hat = torch.tensor([[0.1, 0.3, 0.6], [0.3, 0.2, 0.5]])
y_hat[[0, 1], y]
这段代码其实要注意最后一句,y_hat[[0, 1], y]意思是以tensor y内部的内容作为索引号,对y_bat内部的元素0和1提取对应索引的值。y的第一个元素为0,进而提取y_hat第0个元素内的第0个索引值,即0.1。因此输出的结果为tensor([0.1000, 0.5000])。在定义网络结构和交叉熵的时候,作者的代码写的很巧妙,以至于不太直观,如下:
def net(X):
     return softmax(torch.matmul(X.reshape((-1, W.shape[0])), W) + b)

def cross_entropy(y_hat, y):
     return - torch.log(y_hat[range(len(y_hat)), y])
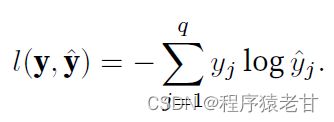
X.resahpe((-1, W.shape[0]))即按照图片的顺序,将X按照每一幅图拉成一个一维向量。-1表示的是缺损值。假设全部数据是L = [18,1,28,28], 18是一个batchsize的尺寸。W.shape[0]表示18,即数据集的尺寸,那么reshape就是(L/18, 18)。这里是为了乘以W(18, 40)而做的转置。而在交叉熵函数中,y_hat[range(len(y_hat)), y],如提到的,就是按照y的索引,来提取y_hat每一个元素对应索引位置的值,即softmax的最大概率值,即实现公式:


