使用echarts仪表盘+柱形图+饼图实现数据可视化
最近公司有个需求,使用echarts仪表盘+柱形图+饼图实现数据可视化,现在功能已经完成,在此做个总结,记录这几天的开发成果。
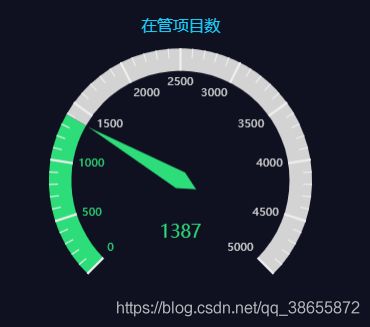
第一模块:仪表盘
1、写好图表容器,设置宽高样式
#areaChart,#percentChart,#projectPerChart,#outerChart,#modeAreaChart{
   width: 100%;
}
#areaChart{
   height: 260px;
   margin-bottom: 30px;
 }
2、仪表盘初始化以及图表配置项
initAreaChart () {
      var chartDom = document.getElementById('areaChart')
      var myChart = echarts.init(chartDom)
      var option = {
        title: { // 标题
          text: '在管项目数',
          x: 'center',
          textStyle: {  // 标题样式
            color: '#17D1FF',
            fontWeight: 500,
            fontSize: 14
          },
          textAlign: 'left'  // 标题居中
        },
        tooltip: {
          show: true
        },
        series: [
          {
            name: '在管项目数',
            type: 'gauge',  // 仪表盘类型
            detail: {
              fontSize: 16
            },
            data: [{value: this.total.projectCount, name: ''}],//仪表盘数据,接口返回
            max: 5000,  // 仪表盘最大值
            radius: '90%',  // 仪表盘占比容器大小
            center: ['50%', '57%'],  // 仪表盘位置
            axisLine: {
              lineStyle: {  // 仪表盘轴线颜色
                color: [[this.total.projectCount / 5000, '#2CDD79'], [1, '#D3D3D4']],
                width: 20 // 修改轴线宽度
              }
            },
            splitLine: {  // 仪表盘刻度长度
              length: 20
            },
            axisLabel: {  // 仪表盘刻度字体大小
              fontSize: 10
            }
          }
        ]
      }
      myChart.setOption(option)
    }
3、进入页面时调用,生成仪表盘
this.initAreaChart()4、最后的渲染效果
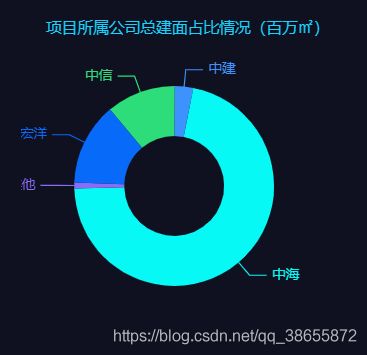
第二模块:饼图
1、写好图表容器,设置宽高样式
2、饼图数据都是接口返回的,项目需求是饼图中的模块数量不确定,而前五种颜色要固定,不能随机,否则和整体设计风格不协调,以下是饼图图表配置项:
initPercentChart () {
      var chartDom = document.getElementById('percentChart')
      var myChart = echarts.init(chartDom)
      var option = {
        title: {
          text: '各开发商在管总建面占比情况(百万㎡)',
          x: 'center',
          textStyle: {
            color: '#17D1FF',
            fontWeight: 500,
            fontSize: 14
          },
          textAlign: 'left'
        },
        tooltip: {  //格式化tooltip
          trigger: 'item',
          formatter: function (res) {
            return res.name + ':' + (res.value / 1000000).toFixed(2) + '(' + res.percent + '%)'
          }
          // formatter: '{b}: {(c/1000000).toFix(2)}百万 ({d}%)'
        },
        series: [
          {
            name: '开发商',
            type: 'pie',
            radius: ['30%', '60%'],  // 饼图大小
            center: ['46%', '50%'],  // 饼图位置
            avoidLabelOverlap: false,
            startAngle: 130, // 起始角度
            label: {
              show: true
            },
            labelLine: {  // 饼图文字指向线
              show: true
            },
            data: this.developer, // 饼图数据,后端返回
            itemStyle: {
              emphasis: {  // 鼠标移上去的效果
                shadowBlur: 10,
                shadowOffsetX: 0,
                shadowColor: 'rgba(0, 0, 0, 0.5)'
              },
              normal: {
                color: function (params) {  // 饼图各模块颜色,提前设置好6种,超出6中颜色随机
                  // 自定义颜色
                  var colorList = [
                    '#2CDD79', '#3D92FD', '#07F9F6', '#07C2F9', '#076AF9', '#FE8463'
                  ]
                  return colorList[params.dataIndex]
                }
              }
            }
          }
        ]
      }
      myChart.setOption(option)
    }
3、调用生成图表
this.initPercentChart()4、最后的渲染效果
第三模块:柱形图
说明:柱形图数据有左右2个刻度,左边是面积,以百万为单位,右边是数量,最多只有几百;X轴的文字很多,要垂直显示;柱形颜色有渐变。以下是配置项代码:
initCompanyAreaChart () {
      var chartDom = document.getElementById('companyAreaChart')
      var myChart = echarts.init(chartDom)
      var option = {
        title: {
          text: '平台公司在管项目数及在管总建面(百万㎡)',
          x: 'center',
          textStyle: {
            color: '#17D1FF',
            fontWeight: 500,
            fontSize: 14
          },
          textAlign: 'left'
        },
        tooltip: {
          trigger: 'axis',
          axisPointer: {
            type: 'cross',
            crossStyle: {
              color: '#999'
            }
          },
          formatter: function (params) {  //tooltip格式化,由于有个颜色是渐变,所以要特殊处理
            var result = params[0].name + '
'
            params[0].marker = ''
            params.forEach(function (item) {
              if (item.seriesName === '在管面积') {
                result += item.marker + ' ' + item.seriesName + ' : ' + (item.value / 1000000).toFixed(2) + ''
              } else {
                result += item.marker + ' ' + item.seriesName + ' : ' + item.value + ''
              }
            })
            return result
          }
        },
        toolbox: {
          show: false
        },
        grid: {
          top: '18%',
          left: '0%',
          right: '0%',
          bottom: '0%',
          containLabel: true
        },
        xAxis: [
          {
            type: 'category',
            data: this.companyName,
            axisPointer: {
              type: 'shadow'
            },
            axisLabel: { // 使X轴文字垂直显示
              color: '#A3A4A8',
              formatter: function (value) {
                return value.split('').join('\n')
              }
            },
            axisLine: {
              lineStyle: {
                color: '#0C3962'
              }
            },
            axisTick: {
              lineStyle: {
                color: '#0C3962'
              }
            }
          }
        ],
        yAxis: [
          {
            type: 'value', // 左边Y轴刻度
            name: '',
            min: 0,
            // max: 200000,
            // interval: 40000,
            axisLabel: { // 修改Y轴刻度颜色和值的格式化
              color: '#2B79DD',
              fontWeight: 'bold',
              formatter: function (res) {
                return (res / 1000000).toFixed(0)
              }
            },
            axisLine: {
              lineStyle: {
                color: '#0C3962'
              }
            },
            axisTick: {
              show: false,
              lineStyle: {
                color: '#0C3962'
              }
            },
            splitLine: {
              show: true,
              lineStyle: {
                color: '#0C3962'
              }
            }
          },
          {
            type: 'value',  // 右边Y轴刻度
            name: '',
            min: 0,
            // max: 500,
            // interval: 100,
            axisLabel: {
              color: '#3EB177',
              fontWeight: 'bold'
            },
            axisLine: {
              lineStyle: {
                color: '#0C3962'
              }
            },
            axisTick: {
              show: false,
              lineStyle: {
                color: '#0C3962'
              }
            },
            splitLine: {
              show: true,
              lineStyle: {
                color: '#0C3962'
              }
            }
          }
        ],
        series: [
          {
            name: '在管面积',
            type: 'bar',
            data: this.companyArea,
            itemStyle: {
              normal: { // 柱形颜色设置渐变
                color: new echarts.graphic.LinearGradient(0, 0, 0, 1, [{
                  offset: 0,
                  color: '#2B89FF'
                }, {
                  offset: 1,
                  color: '#76C8FF'
                }])
              }
            }
          },
          {
            name: '在管项目数',
            type: 'bar',
            yAxisIndex: 1,
            data: this.companyCount,
            itemStyle: {
              normal: {
                color: '#01FFBF'
              }
            }
          }
        ]
      }
      myChart.setOption(option)
    }
最终效果:
最后,结束语
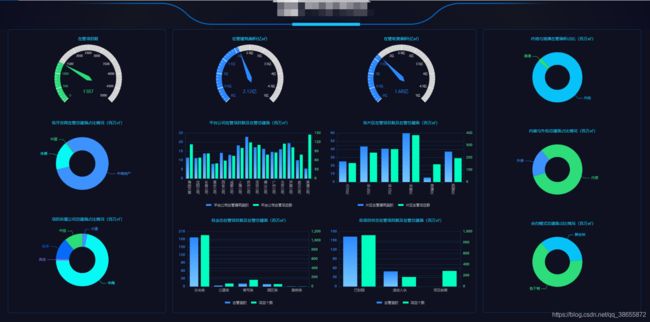
整个功能整体效果呈现:


