利用python求解tsp问题
我使用的TSP数据集在这里
TSP数据集
用到的python库有这些
import pandas as pd
import numpy as np
import re
import matplotlib.pyplot as plt
import random
我使用的是具有51个城市的数据集,一开始要对其进行数据上的整理(因为它每个城市的x,y轴都挤在了一个单元格里面)
整理的代码如下
1.整理excel表格
df=pd.read_excel(r'C:\Users\17115\Desktop\校赛A题\tsp.xlsx')
# print(df)
#将csv一列数据挤在了一起将其拆分
#创建数组
f=np.zeros((51,3))
c=0
for i in range(0,51,1):
#利用正则表达式拆开数据,分别放到不同的单元格里面
    k=re.findall(r'\d+(?:\.\d+)?', df["a"][i])
    f[c][0]=k[0]
    f[c][1] = k[1]
    f[c][2] = k[2]
    c=c+1
# print(f)

#将f写入新的xslx当中,numpy不能使用直接使用toexcel
data=pd.DataFrame(f)
data.to_excel(r'C:\Users\17115\Desktop\1.xlsx',index=0)
2.整理好excel表格以后,计算距离矩阵(matrix使用了全局变量因为,有个juli函数会调用)
#全局变量
df1 = pd.read_excel(r'C:\Users\17115\Desktop\1.xlsx')
matrix = np.zeros((51, 51))
for i in range(0, 51, 1):
    for j in range(0, 51, 1):
        matrix[i][j] = np.sqrt((df1[1][i] - df1[1][j]) ** 2 + (df1[2][i] - df1[2][j]) ** 2)
print(df1)

def juli(a,b):
    return matrix[a][b]
通过蒙特卡罗算法
3.主函数,生成100000个随机解进行比较,求出最优路径
#创建数组
f=np.zeros((51,3))
c=0
for i in range(0,51,1):
    k=re.findall(r'\d+(?:\.\d+)?', df["a"][i])
    f[c][0]=k[0]
    f[c][1] = k[1]
    f[c][2] = k[2]
    c=c+1
# print(f)

#将f写入新的xslx当中,numpy不能使用直接使用toexcel
data=pd.DataFrame(f)
data.to_excel(r'C:\Users\17115\Desktop\1.xlsx',index=0)


#初始化最短路径
min_result=float("inf")
min_path=np.arange(0,51,1)
#并且要在末尾添加一个返回值
min_path=np.append(min_path,min_path[0])
#蒙特卡罗模拟次数
N=1000
for i in range(1,N,1):
    #初始化,走过的路程为0
    walk=0
    s=np.arange(0,51,1)
    # print(s)
    random.shuffle(s)
    # print(s[0])
    #调用函数,更新走过的路程
    for i in range(0,50,1):
        walk=walk+juli(s[i],s[i+1])
    #加上最后一个城市返回第一个城市的距离
    walk=walk+juli(s[i],s[0])
    # print("i" + str(i))
    if walk<min_result:
        min_result=walk
        min_path=s
#最后一个城市要回到第一个城市,添加path(0),构成封闭
    # m=min_path.tolist()
    # print(s[0])
    # m=m.append(s[0])
    # print(type(m))
    # print("s[0]"+str(s[0]))
    #np.append()
    min_path=np.append(min_path,s[0])
#输出结果
print("输出的路径为:")
print(min_path)
print("输出的结果为:")
print(min_result)
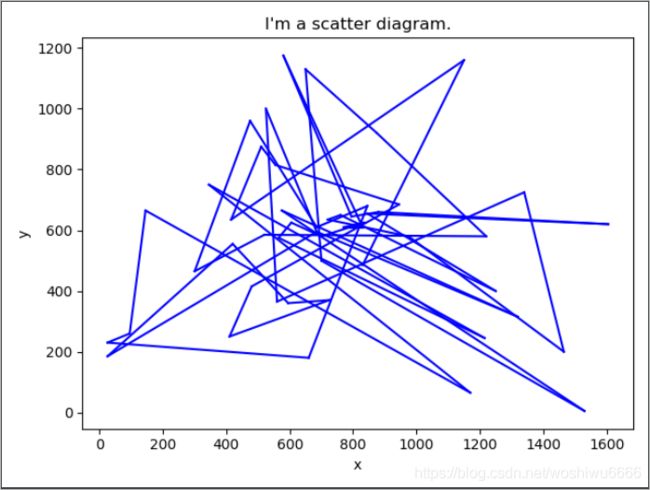
##作图
#利用坐标作图
plt.title("I'm a scatter diagram.")
# plt.xlim(xmax=10,xmin=0)
# plt.ylim(ymax=10,ymin=0)
#箭头
# plt.annotate("(3,6)", xy = (3, 6), xytext = (4, 5), arrowprops = dict(facecolor = 'black', shrink = 0.1))
plt.xlabel("x")
plt.ylabel("y")
for i in range(0,50,1):
     # plt.plot([[df1[1][min_path[i]],df1[1][min_path[i+1]]]],[[df1[2][min_path[i]],df1[2][min_path[i+1]]]],'k-',lw=1)
     # print([[df1[1][min_path[i]],df1[1][min_path[i+1]]]])
     # print([[df1[2][min_path[i]],df1[2][min_path[i+1]]]])
     plt.plot([df1[1][min_path[i]],df1[1][min_path[i+1]]],[df1[2][min_path[i]],df1[2][min_path[i+1]]],color='b')
     # plt.plot([[df1[1][min_path[i]],df1[1][min_path[i+1]]]],[[df1[2][min_path[i]],df1[2][min_path[i+1]]]], color='b')
plt.show()
最优路径为
[17  7 14 24  3 33 21 41 20 22 11 34 46 26 35 42 16 30 15 43 29 38 25 45
  5 13 50 39  6 31 48 23 27 47 37 49  2  1  9 19 10  4  0 36 44 32 40 28
 12 18  8 17]
路径长度为
25436.257985759978
再使用模拟退火算法去求解
模拟退火的参数设置如下
#模拟退火参数初始化
T=1000#初始化温度
MAX=1000#最大迭代次数
MAX1=500#每个温度下的迭代次数
alpfa=0.95#温度衰减系数
代码如下
import pandas as pd
import numpy as np
import re
import matplotlib.pyplot as plt
import random
import math

#全局变量
df1 = pd.read_excel(r'C:\Users\17115\Desktop\1.xlsx')
matrix = np.zeros((51, 51))
for i in range(0, 51, 1):
    for j in range(0, 51, 1):
        matrix[i][j] = np.sqrt((df1[1][i] - df1[1][j]) ** 2 + (df1[2][i] - df1[2][j]) ** 2)
# print(df1)

#生成新路径的函数
def gen_new_path(path):
    #随机选择两种方式产生新路径
    p1=0.33#使用交换法产生新路径概率
    p2=0.33#使用位移法产生新路径概率
    r=random.random()#生成一个0-1之间的随机数
    # 使用交换法生成路径
    if r<p1:
        #生成0-50的随机整数
        c1=random.randint(0,50)
        # 生成0-50的随机整数
        c2= random.randint(0, 50)
        #python数组赋值是共用??
        path1=path
        k=path1[c1]
        path1[c1]=path[c2]
        path1[c2]=k
        # 使用移位法产生新路径
        #这个好像没有用
    elif r<p1+p2:
        path1=0
        c1=random.randint(0,50)
        c2 = random.randint(0, 50)
        c3 = random.randint(0, 50)
        list=[c1,c2,c3]
        list.sort()
        c1=list[0]
        c2=list[1]
        c3=list[2]
        #利用切片分段
        #最后那个值不一定与它前面的那个起点相同
        tem1=path[0:c1]
        tem2=path[c1:c2]
        tem3=path[c2:c3]
        tem4=path[c3:51]
        path1=np.append(path1,tem1)
        path1=np.append(path1,tem3)
        path1 = np.append(path1, tem2)
        path1 = np.append(path1, tem4)
        path1 = path1[1:52]
    else:
        path1=0
        #随机数(0,50)取50,后面的j有可能等于52,而序列为0-51(52个数),52超出范围
        c1=random.randint(0,50)
        c2 = random.randint(0, 50)
        if c1>c2:
            tem=c2
            c2=c1
            c1=tem
        tem1=path[0:c1]
        tem2=path[c1:c2]
        #对tem2进行fliplr操作,左右翻转
        #翻转这里有问题
        f=c2-c1+1
        j=c2-1
        for i in (c1,(int)(f/2),1):
            k = path[i]
            path[i] = path[j]
            path[j] = k
            j = j - 1
        tem3=path[c2:52]
        path1 = np.append(path1, tem1)
        path1 = np.append(path1, tem2)
        path1 = np.append(path1, tem3)
        path1=path1[1:52]
        # print("path1:")
        # print(path1)
        # print(path1.shape())
    return path1

#计算距离函数
def caculate(path0):
    walk=0
    # print("path0:")
    # print(path0)
    for i in range(0,50,1):
        walk=walk+matrix[path0[i],path0[i+1]]
    #加上最后一个城市返回第一个城市的距离
    walk=walk+matrix[path0[i],path0[0]]
    return walk

#模拟退火参数初始化
T=1000#初始化温度
MAX=1000#最大迭代次数
MAX1=500#每个温度下的迭代次数
alpfa=0.95#温度衰减系数

#初始化最短路径
min_result=float("inf")
result0=float("inf")
min_path=np.arange(0,51,1)
# min_path=np.append(min_path,0)
path0=min_path

#模拟退火过程
for i in range(1,MAX,1):
    for j in range(1,MAX1,1):
        #拿path0去生成新的路径,距离
        #传0到50进去,51不用传进去
        path1=gen_new_path(path0[0:51])
        # print(path1)
        path1=np.append(path1,path1[0])
        # print("path1:")
        # print(path1)
        result=caculate(path1)
        #与前一个解的最小距离进行比较
        if result<result0:
            path0=path1
            result0=result
        else:
            #计算不符合if中的条件,接收新解的概率
            p=math.exp(-(result-min_result)/T)
            if random.random()<p:
                path0=path1
                result0 = result
        #与前面所有解中的最小距离进行比较
        if result0<min_result:
            min_result=result0
            min_path=path0
    T=alpfa*T

#输出最优路径
print("最优路径:")
print(min_path)
#输出最优距离的结果
print("最优距离:")
print(min_result)

#作图
#利用坐标作图
plt.title("I'm a scatter diagram.")
plt.xlabel("x")
plt.ylabel("y")
#一共有51个城市,52个点
for i in range(0,51,1):
     plt.plot([df1[1][min_path[i]],df1[1][min_path[i+1]]],[df1[2][min_path[i]],df1[2][min_path[i+1]]],color='b')
plt.show()
最优路径
[45 32 17 18 44  3 22 29 15 49 30  1 34 26 31 13 43  9 42 11 21 20 40 35
 14 28  6 41 16 46  2 25  0 48 33 23 36 47  8 37  5 10  4 27 39 38 24 12
 50 19  7 34]
最优距离
20413.542699599373

