Logistic回归 vs 前馈神经网络(正确的弯月数据集分类)
一、问题描述
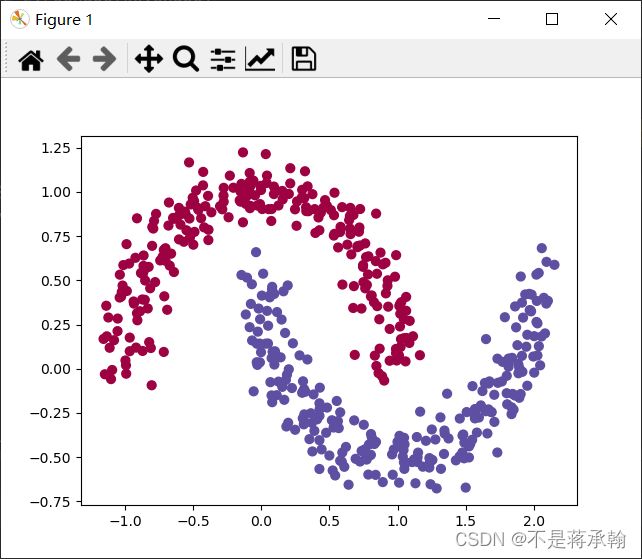
弯月数据是sklearn工具库提供的一个数据集。它上用于分类和聚类算法的实践实验。图中每一个点是一条数据。其中(x1,x2)是特征组,颜色是标签值。
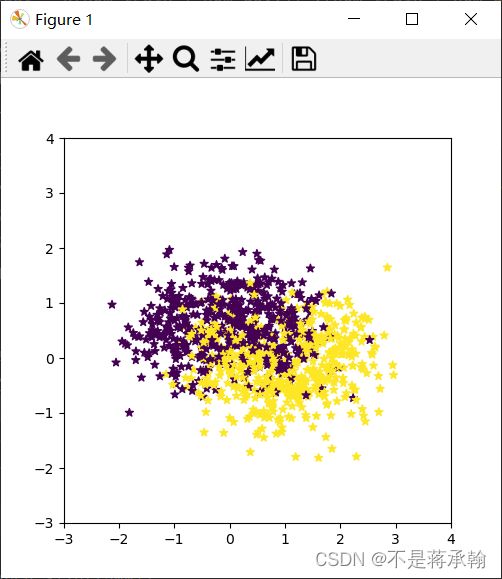
在邱老师给出的代码中,弯月数据集的噪声太大,所以看起来很像两团独立的数据,如下图所示。
这样的两团数据,无论是Logistic回归还是前馈神经网络都可以轻易的将他分类,不利于咱们比较他俩,所以接下来的分类我直接调用sklearn库内的弯月数据集。
先导入包
import torch
import numpy as np
from torch import nn
from torch.autograd import Variable
import torch.nn.functional as F
import matplotlib.pyplot as plt
直接调用sklearn库内的弯月数据集
x, y = make_moons(n_samples=500, noise=0.1)
plt.scatter(x[:,0],x[:,1],c=y.reshape(-1),s=40,cmap=plt.cm.Spectral)
plt.show()
这个数据就不像简简单单的两团数据了,下面试试用Logistic回归能不能将他们分开。
x = torch.from_numpy(x).float()
y = torch.from_numpy(y).float().reshape(500,1)
w = nn.Parameter(torch.randn(2, 1))
b = nn.Parameter(torch.zeros(1))
optimizer = torch.optim.SGD([w, b], 1e-1)


def logistic_regression(x):
    return torch.mm(x, w) + b


criterion = nn.BCEWithLogitsLoss()
for e in range(10000):
    out = logistic_regression(Variable(x))
    loss = criterion(out, Variable(y))
    optimizer.zero_grad()
    loss.backward()
    optimizer.step()
    if (e + 1) % 1000 == 0:
        print('epoch:{},loss:{}'.format(e + 1, loss.item()))

def plot_logistic(x):
    x=Variable(torch.from_numpy(x).float())
    out=torch.sigmoid(logistic_regression(x))
    out =(out>0.5)*1
    return out.data.numpy()

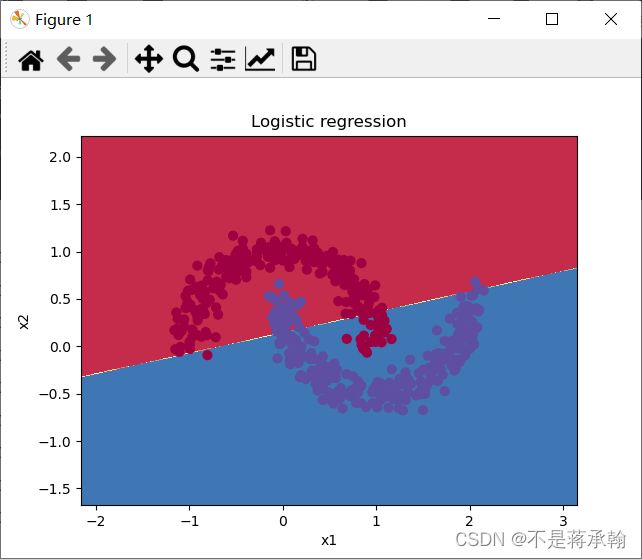
plot_decision_boundary(lambda x: plot_logistic(x), x.numpy(), y.numpy())
plt.title('Logistic regression')
# Text(0.5,1,'logistic regression')
plt.show()
epoch:1000,loss:0.26829764246940613
epoch:2000,loss:0.2621712386608124
epoch:3000,loss:0.26104626059532166
epoch:4000,loss:0.26078203320503235
epoch:5000,loss:0.2607133388519287
epoch:6000,loss:0.26069459319114685
epoch:7000,loss:0.2606893479824066
epoch:8000,loss:0.260687917470932
epoch:9000,loss:0.2606874704360962
epoch:10000,loss:0.26068735122680664
可以看出,即使经过10000次训练,Logistic回归依然不能将弯月数据集完美地分为两类,因为他只是一条直线,永远无法分离两个勾心斗角的弯月。(plot_decision_boundary函数)放在最后
接下来看看神经网络表现如何
# 定义两层神经网络的参数
w1 = nn.Parameter(torch.randn(2, 4) * 0.01)  # 隐藏层神经元个数2
b1 = nn.Parameter(torch.zeros(4))

w2 = nn.Parameter(torch.randn(4, 1) * 0.01)
b2 = nn.Parameter(torch.zeros(1))


# 定义模型
def two_network(x):
    x1 = torch.mm(x, w1) + b1
    x1 = torch.tanh(x1)
    x2 = torch.mm(x1, w2) + b2
    return x2


optimizer = torch.optim.SGD([w1, w2, b1, b2],
                            1.)  # SGD 随机梯度下降。为了使用torch.optim,需要构建optimizer对象,这个对象能够保持当前参数状态并基于计算得到的梯度进行参数更新
criterion = nn.BCEWithLogitsLoss()
# 我们训练10000次
for e in range(10000):
    out = two_network(Variable(x))
    loss = criterion(out, Variable(y))
    optimizer.zero_grad()
    loss.backward()
    optimizer.step()
    if (e + 1) % 1000 == 0:
        print('epoch:{},loss:{}'.format(e + 1, loss.item()))

def plot_network(x):
    x = Variable(torch.from_numpy(x).float())
    x1 = torch.mm(x, w1) + b1
    x1 = F.tanh(x1)
    x2 = torch.mm(x1, w2) + b2
    out = F.sigmoid(x2)
    out = (out > 0.5) * 1
    return out.data.numpy()


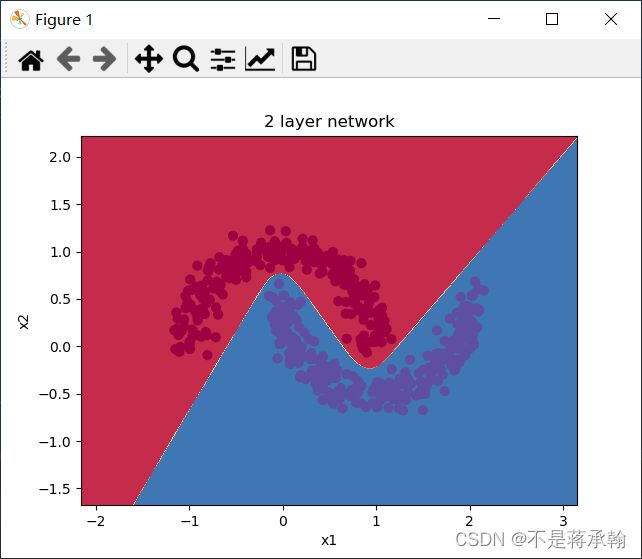
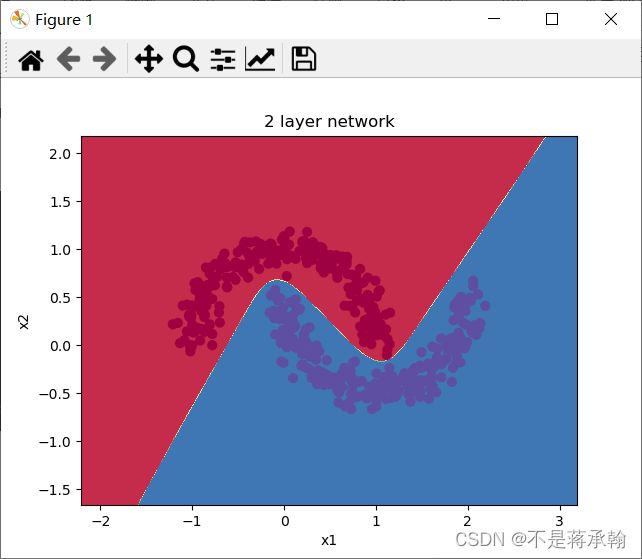
plot_decision_boundary(lambda x: plot_network(x), x.numpy(), y.numpy())
plt.title('2 layer network')
plt.show()
epoch:1000,loss:0.2617390751838684
epoch:2000,loss:0.007825212553143501
epoch:3000,loss:0.002963123843073845
epoch:4000,loss:0.0018243270460516214
epoch:5000,loss:0.0013165698619559407
epoch:6000,loss:0.0010290913050994277
epoch:7000,loss:0.000844114925712347
epoch:8000,loss:0.0007151389727368951
epoch:9000,loss:0.0006200855714268982
epoch:10000,loss:0.0005471492186188698
经过同样的10000次训练,神经网络很圆滑地很完美地把弯月数据集分为了两类,从loss上看,神经网络好像并不需要这么多次的训练,在1000-2000次之间,loss就已经降到很低,现在训练2000次看看效果。
for e in range(2000):
    out = two_network(Variable(x))
    loss = criterion(out, Variable(y))
    optimizer.zero_grad()
    loss.backward()
    optimizer.step()
    if (e + 1) % 1000 == 0:
        print('epoch:{},loss:{}'.format(e + 1, loss.item()))
epoch:1000,loss:0.06799769401550293
epoch:2000,loss:0.005060579627752304
可以看到神经网络还是能够非常好地分类这个复杂的数据,和前面的 Logistic 回归相比,神经网络因为有了激活函数的存在,成了一个非线性分类器,所以神经网络分类的边界更加复杂。
plot_decision_boundary函数,用来绘制边界
def plot_decision_boundary(model,x,y):
    #设置最小值和最大值,并给它一些空白
    x_min,x_max=x[:,0].min()-1,x[:,0].max()+1
    y_min,y_max=x[:,1].min()-1,x[:,1].max()+1
    h=0.01
    #生成点的网格,点之间的距离为h
    xx,yy=np.meshgrid(np.arange(x_min,x_max,h),np.arange(y_min,y_max,h))
    #Predict the function value for the whole grid
    z=model(np.c_[xx.ravel(),yy.ravel()])
    z=z.reshape(xx.shape)
    #绘制等高线和训练示例
    plt.contourf(xx,yy,z,cmap=plt.cm.Spectral)
    plt.ylabel('x2')
    plt.xlabel('x1')
    plt.scatter(x[:,0],x[:,1],c=y.reshape(-1),s=40,cmap=plt.cm.Spectral)
参考
月亮数据预测(决策树和随机森林算法)_汪程序猿的博客-CSDN博客_对月亮数据训练并微调一个决策树
可视化技巧:分类问题中的决策面画法 (直观理解plt.contour的用法)_此人姓于名叫罩百灵的博客-CSDN博客_plt.contour
