Python数据分析学习系列一——Matplotlib入门学习
1 Matplotlib-介绍
- Matplotlib是一个强大的Python绘图和数据可视化的工具包。
- 安装方法:pip install matplotlib
- 引用方法: import matplotlib.pyplot as plt
- 绘图函数:plt.plot()
- 显示函数:plt.show()
import matplotlib.pyplot as plt
1.1 Plot-简单使用
plt.plot() # 画图,主要是折线图
plt.show() # 展示图形
plt.plot([1, 2, 3, 4], [2, 3, 1, 7]) # 两个参数,x和y,可以是列表,也可以是numpy的array
plt.show()
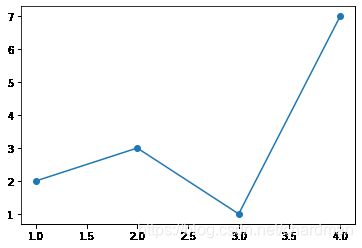
plt.plot([1, 2, 3, 4], [2, 3, 1, 7], 'o-') #“o”代表点,“-”代表线
plt.show()
- plot函数:绘制折线图
- 线型linestyle(-,-.,–,:)
- 点型marker(v.^,S,* ,H,+,x,D,o,…)
- 颜色color(b,g,r,y,k,w,…)
- plot函数可以同时绘制多条曲线
- pandas包对plot的支持
plt.plot([1, 2, 3, 4], [2, 3, 1, 7], 'H-') #“H”代表六边形,“-”代表线
plt.show()
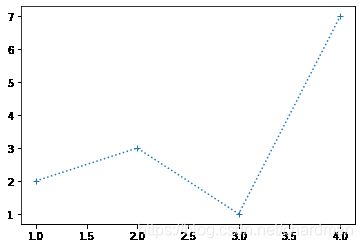
plt.plot([1, 2, 3, 4], [2, 3, 1, 7], '+:') #“:”代表线虚线
plt.show()
Markers
| character | description |
|---|---|
'.' |
point marker |
',' |
pixel marker |
'o' |
circle marker |
'v' |
triangle_down marker |
'^' |
triangle_up marker |
'<' |
triangle_left marker |
'>' |
triangle_right marker |
'1' |
tri_down marker |
'2' |
tri_up marker |
'3' |
tri_left marker |
'4' |
tri_right marker |
's' |
square marker |
'p' |
pentagon marker |
'*' |
star marker |
'h' |
hexagon1 marker |
'H' |
hexagon2 marker |
'+' |
plus marker |
'x' |
x marker |
'D' |
diamond marker |
'd' |
thin_diamond marker |
| ``’ | '`` |
'_' |
hline marker |
Line Styles
| character | description |
|---|---|
'-' |
solid line style |
'--' |
dashed line style |
'-.' |
dash-dot line style |
':' |
dotted line style |
Colors
The supported color abbreviations are the single letter codes
| character | color |
|---|---|
'b' |
blue |
'g' |
green |
'r' |
red |
'c' |
cyan |
'm' |
magenta |
'y' |
yellow |
'k' |
black |
'w' |
white |
Example format strings::
'b'    # blue markers with default shape
'or'   # red circles
'-g'   # green solid line
'--'   # dashed line with default color
'^k:'  # black triangle_up markers connected by a dotted line
1.2 plot-函数周边
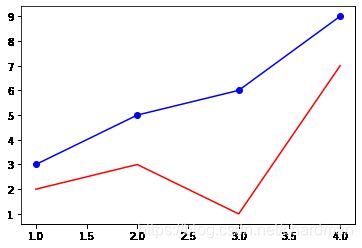
# 同时画两条线
plt.plot([1, 2, 3, 4], [2, 3, 1, 7], color='red')
plt.plot([1, 2, 3, 4], [3, 5, 6, 9], color='blue', marker='o')
plt.show()
- 设置图像标题:plt.title()
- 设置x轴名称:plt.xlabel()
- 设置y轴名称:plt.ylabel()
- 设置x轴范围:plt.xlim()
- 设置y轴范围:plt.ylim()
- 设置x轴刻度:plt.xticks()
- 设置y轴刻度:plt.yticks()
- 设置曲线图例:plt.legend()
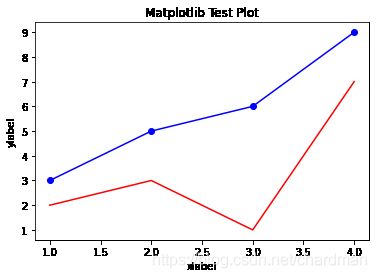
plt.plot([1, 2, 3, 4], [2, 3, 1, 7], color='red')
plt.plot([1, 2, 3, 4], [3, 5, 6, 9], color='blue', marker='o')
plt.title('Matplotlib Test Plot')
plt.xlabel('xlabel')
plt.ylabel('ylabel')
plt.show()
# 绘图显示中文乱码解决办法
plt.rcParams['font.sans-serif']=['SimHei']
plt.rcParams['axes.unicode_minus']=False
plt.plot([1, 2, 3, 4], [2, 3, 1, 7], color='red')
plt.plot([1, 2, 3, 4], [3, 5, 6, 9], color='blue', marker='o')
plt.title('Matplotlib Test Plot')
plt.xlabel('x轴')
plt.ylabel('y轴')
plt.show()
plt.plot([1, 2, 3, 4], [2, 3, 1, 7], color='red')
plt.plot([1, 2, 3, 4], [3, 5, 6, 9], color='blue', marker='o')
plt.title('Matplotlib Test Plot')
plt.xlabel('x轴')
plt.ylabel('y轴')
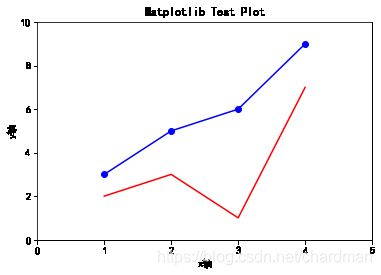
plt.xlim(0, 5) # 设置x轴范围
plt.ylim(0, 10) # 设置y轴范围
plt.show()
plt.plot([1, 2, 3, 4], [2, 3, 1, 7], color='red')
plt.plot([1, 2, 3, 4], [3, 5, 6, 9], color='blue', marker='o')
plt.title('Matplotlib Test Plot')
plt.xlabel('x轴')
plt.ylabel('y轴')
plt.xlim(0, 5) # 设置x轴范围
plt.ylim(0, 10) # 设置y轴范围
plt.xticks([0,2,4,6]) #设置x轴刻度,输入参数需要是列表或array数组
plt.yticks([0,3,6,9]) #设置y轴刻度,输入参数需要是列表或array数组
plt.show()
import numpy as np
plt.plot([1, 2, 3, 4], [2, 3, 1, 7], color='red')
plt.plot([1, 2, 3, 4], [3, 5, 6, 9], color='blue', marker='o')
plt.title('Matplotlib Test Plot')
plt.xlabel('x轴')
plt.ylabel('y轴')
plt.xlim(0, 5) # 设置x轴范围
plt.ylim(0, 10) # 设置y轴范围
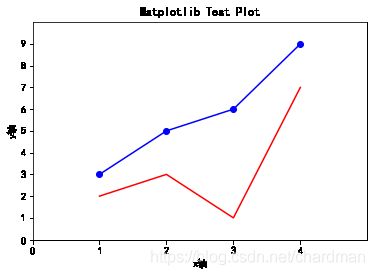
plt.xticks(np.arange(5)) #设置x轴刻度,输入参数需要是列表或array数组
plt.yticks(np.arange(10)) #设置y轴刻度,输入参数需要是列表或array数组
plt.show()
plt.plot([1, 2, 3, 4], [2, 3, 1, 7], color='red')
plt.plot([1, 2, 3, 4], [3, 5, 6, 9], color='blue', marker='o')
plt.title('Matplotlib Test Plot')
plt.xlabel('x轴')
plt.ylabel('y轴')
plt.xlim(0, 5) # 设置x轴范围
plt.ylim(0, 10) # 设置y轴范围
plt.xticks(np.arange(5), ['a','b','c','d','e']) #可以把刻度转换成标签
plt.yticks(np.arange(10))
plt.show()
# 设置图例
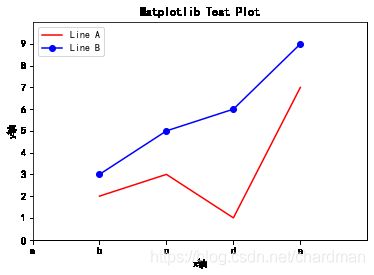
plt.plot([1, 2, 3, 4], [2, 3, 1, 7], color='red', label='Line A')
plt.plot([1, 2, 3, 4], [3, 5, 6, 9], color='blue', marker='o', label='Line B')
plt.title('Matplotlib Test Plot')
plt.xlabel('x轴')
plt.ylabel('y轴')
plt.xlim(0, 5) # 设置x轴范围
plt.ylim(0, 10) # 设置y轴范围
plt.xticks(np.arange(5), ['a','b','c','d','e']) #可以把刻度转换成标签
plt.yticks(np.arange(10))
plt.legend()
plt.show()
plt.legend?
# 设置图例位置
plt.plot([1, 2, 3, 4], [2, 3, 1, 7], color='red', label='Line A')
plt.plot([1, 2, 3, 4], [3, 5, 6, 9], color='blue', marker='o', label='Line B')
plt.title('Matplotlib Test Plot')
plt.xlabel('x轴')
plt.ylabel('y轴')
plt.xlim(0, 5) # 设置x轴范围
plt.ylim(0, 10) # 设置y轴范围
plt.xticks(np.arange(5), ['a','b','c','d','e']) #可以把刻度转换成标签
plt.yticks(np.arange(10))
plt.legend(loc='lower right')
# 图的四个角落'upper left', 'upper right', 'lower left', 'lower right'
# 上下左右边缘的中间'upper center', 'lower center', 'center left', 'center right'
plt.show()
1.3 pandas-画图
import pandas as pd
df = pd.read_csv('399300.csv', parse_dates=['日期'], index_col='日期')[['开盘价','最高价','最低价','收盘价']]
df.head()
| 开盘价 | 最高价 | 最低价 | 收盘价 | |
|---|---|---|---|---|
| 日期 | ||||
| 2021-01-29 | 5413.9684 | 5430.2015 | 5288.0955 | 5351.9646 |
| 2021-01-28 | 5450.3695 | 5462.2352 | 5360.3766 | 5377.1427 |
| 2021-01-27 | 5505.7708 | 5534.9928 | 5449.6385 | 5528.0034 |
| 2021-01-26 | 5600.9017 | 5600.9017 | 5505.9962 | 5512.9678 |
| 2021-01-25 | 5564.1237 | 5655.4795 | 5543.2663 | 5625.9232 |
# DataFrame画图
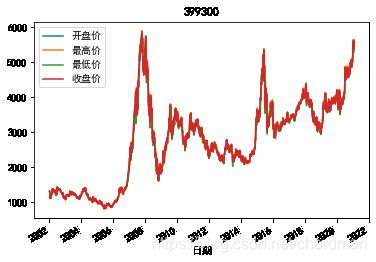
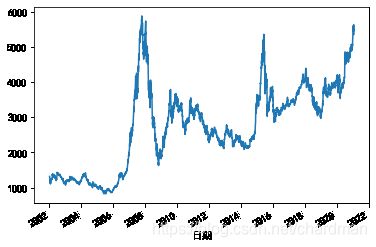
df.plot()
plt.title('399300')
plt.show()
# Series画图
sr = df['收盘价']
sr.plot()
plt.show()
import numpy as np
x = np.linspace(-5,5,1000)
y1 = x
y2 = x**2
y3 = x**3
plt.plot(x,y1,'r',label='y=x')
plt.plot(x,y2,'g',label='y=x^2')
plt.plot(x,y3,'b',label='y=x^3')
plt.show()
1.4 Matplotlib-画布与子图
- 画布:figure
- fig = plt.figure()
- 子图:subplot
- ax1 = fig.add_subplot(2,2,1)
- 调节子图间距:
- subplots_adjust(left, bottom, right, top, wspace, hspace)
fig = plt.figure()
ax1 = fig.add_subplot(2, 2, 1) # 2行2列中的第1个位置
ax1.plot([1, 2, 3, 4], [5, 4, 7, 5])
plt.show()
fig = plt.figure()
ax1 = fig.add_subplot(2, 2, 1) # 2行2列中的第1个位置
ax1.plot([1, 2, 3, 4], [5, 4, 7, 5])
ax2 = fig.add_subplot(2, 2, 2) # 2行2列中的第2个位置
ax2.plot([1, 2, 3, 4], [4, 6, 3, 5])
plt.show()
fig = plt.figure()
ax1 = fig.add_subplot(2, 1, 1) # 2行1列中的第1个位置
ax1.plot([1, 2, 3, 4], [5, 4, 7, 5])
ax2 = fig.add_subplot(2, 1, 2) # 2行1列中的第2个位置
ax2.plot([1, 2, 3, 4], [4, 6, 3, 5])
plt.show()
1.5 Matplotlib-支持的图形
| 函数 | 说明 |
|---|---|
| plt.plot(x,y,fmt,…) | 坐标图 |
| plt.boxplot(data,notch,position) | 箱型图 |
| plt.bar(left,height,width,bottom) | 条形图 |
| plt.barh(width,bottom,left,height) | 横向条形图 |
| plt.polar(theta,r) | 极坐标图 |
| plt.ple(data,explore) | 饼图 |
| plt.psd(x,NFFT=256,pad_to,Fs) | 功率密度图 |
| plt.specgram(x,NFFT=256,pad_to,Fs) | 谱图 |
| plt.cohere(x,y,NFFT=256,Fs) | X-Y相关性函数 |
| plt.scatter(x,y) | 散点图 |
| plt.step(x,y,where) | 步阶图 |
| plt.hist(x,bins,normed) | 直方图 |
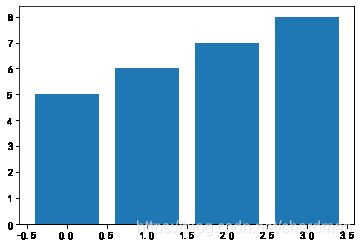
plt.bar([0,1,2,3], [5,6,7,8]) #[0,1,2,3]是位置,[5,6,7,8]是高度
plt.show()
plt.bar([0,1,2,4], [5,6,7,8])
plt.show()
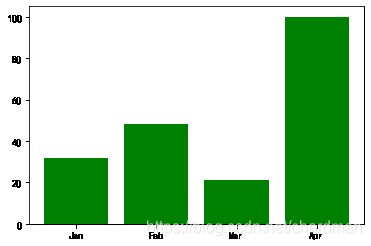
data = [32, 48,21, 100]
labels = ['Jan','Feb','Mar','Apr']
plt.bar(np.arange(len(data)), data, color = 'green')
plt.xticks(np.arange(len(data)), labels)
plt.show()
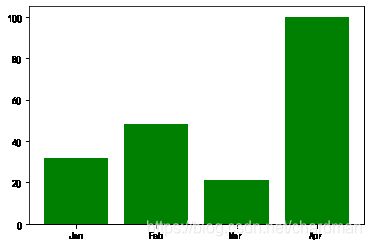
data = [32, 48,21, 100]
labels = ['Jan','Feb','Mar','Apr']
plt.bar(labels, data, color = 'green')
plt.show()
data = [32, 48,21, 100]
labels = ['Jan','Feb','Mar','Apr']
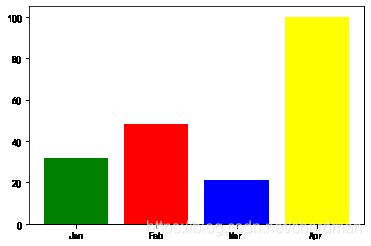
plt.bar(labels, data, color = ['green','red','blue','yellow'])
plt.show()
data = [32, 48,21, 100]
labels = ['Jan','Feb','Mar','Apr']
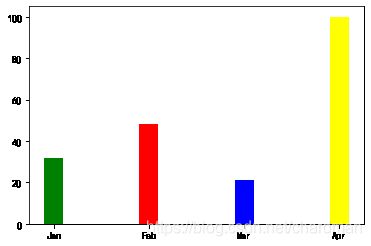
plt.bar(labels, data, color = ['green','red','blue','yellow'], width=0.2)
plt.show()
data = [32, 48,21, 100]
labels = ['Jan','Feb','Mar','Apr']
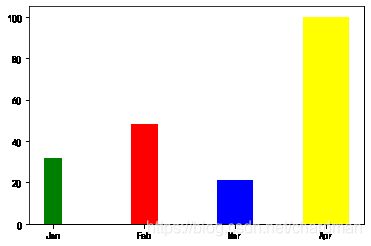
plt.bar(labels, data, color = ['green','red','blue','yellow'], width=[0.2,0.3,0.4,0.5])
plt.show()
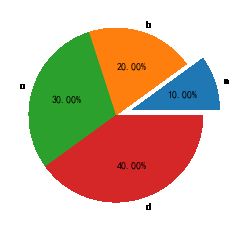
plt.pie([10, 20, 30, 40])
plt.show()
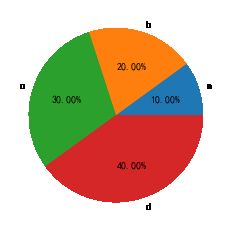
plt.pie([10, 20, 30, 40], labels=['a','b','c','d'], autopct='%.2f%%') #后面要打2个百分号
plt.show()
plt.pie([10, 20, 30, 40], labels=['a','b','c','d'], autopct='%.2f%%', explode = [0.2,0,0,0]) #explode是把特定部分突出
plt.show()
1.6 Matplotlib-绘制K线图
- mlpfinance包中有许多绘制金融相关图的函数接口
- 绘制K线图:mlpfinance.plot函数
import mplfinance as mpf
import pandas as pd
df = pd.read_csv('399300.csv', parse_dates=['日期'], index_col='日期')[['开盘价','最高价','最低价','收盘价','成交量']]
df.head()
| 开盘价 | 最高价 | 最低价 | 收盘价 | 成交量 | |
|---|---|---|---|---|---|
| 日期 | |||||
| 2021-01-29 | 5413.9684 | 5430.2015 | 5288.0955 | 5351.9646 | 18217878400 |
| 2021-01-28 | 5450.3695 | 5462.2352 | 5360.3766 | 5377.1427 | 17048558500 |
| 2021-01-27 | 5505.7708 | 5534.9928 | 5449.6385 | 5528.0034 | 16019084100 |
| 2021-01-26 | 5600.9017 | 5600.9017 | 5505.9962 | 5512.9678 | 17190459000 |
| 2021-01-25 | 5564.1237 | 5655.4795 | 5543.2663 | 5625.9232 | 19704701900 |
# 对数据进行改名,mplfinance名字必须是Date, Open, High, Low, Close, Volume
df.rename(columns={'日期':'Date', '开盘价':'Open', '最高价':'High', '最低价':'Low', '收盘价':'Close', '成交量':'Volume'}, inplace=True)
df.sort_index(ascending=True, inplace=True)
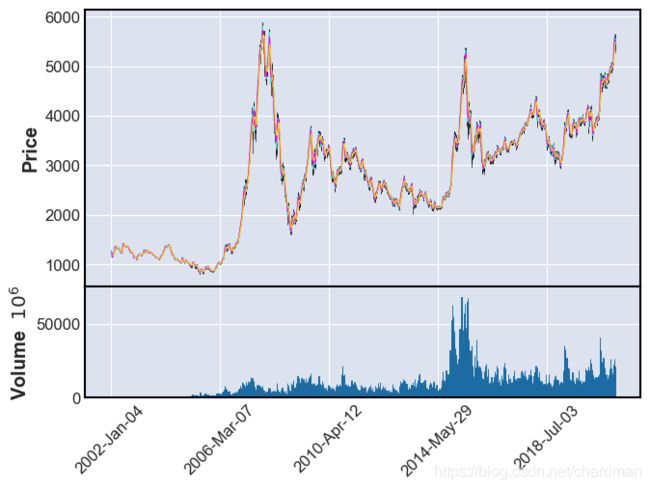
mpf.plot(df, type='candle',mav=(5,10,20), volume=True)
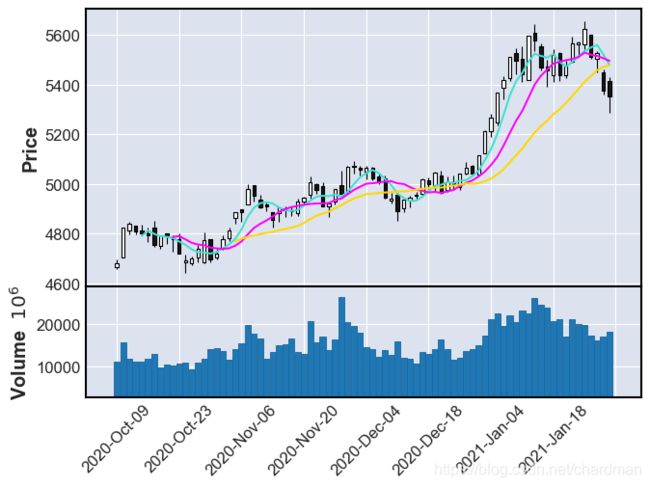
df1 = df['2020-10-01':]
mpf.plot(df1, type='candle',mav=(5,10,20), volume=True)
mpf.show()
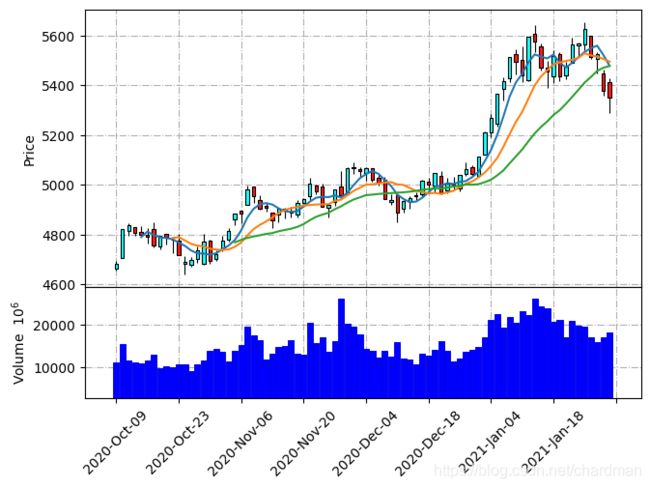
my_color = mpf.make_marketcolors(up='cyan', down='red', edge='black', wick='black', volume='blue')
my_style = mpf.make_mpf_style(marketcolors=my_color, gridaxis='both', gridstyle='-.')
mpf.plot(df1, type='candle',mav=(5,10,20), volume=True, style=my_style)
mpf.show()
-
make_marketcolors() 设置k线颜色
- up 设置阳线柱填充颜色
- down 设置阴线柱填充颜色
- edge 设置蜡烛线边缘颜色 ‘i’ 代表继承k线的颜色
- wick 设置蜡烛上下影线的颜色
- volume 设置成交量颜色
- inherit 是否继承, 如果设置了继承inherit=True,那么edge即便设了颜色也会无效
-
make_mpf_style() 设置mpf样式
- gridaxis:设置网格线位置,both双向
- gridstyle:设置网格线线型
- y_on_right:设置y轴位置是否在右
注:在设置样式前要先设置格式
-
plot绘图的部分参数
- type设置图像类型’ohlc’/‘candle’/‘line/renko’
- mav 绘制平局线
- show_nontrading= True 显示非交易日(k线之间有间隔),False 不显示交易日,k线之间没有间隔
- title:设置标题
- ylabel=设置主图Y轴标题
- ylabel_lower 设置成交量一栏Y坐标标题
- figratio:设置图形纵横比
- figscale 设置图像的缩小或放大,1.5就是放大50%,最大不会超过电脑屏幕大小
- style 设置整个图表样式,可以使用前面设置的样式my_style,只能在plot函数中使用指定整个图表样式,不能在make_addplot中使用。
- savefig:导出图片,填写文件名及后缀


