异常数据处理——3σ原则、箱线图
首先三连问:
异常数据是什么呢?
偏离大部分数据。
但是呢大家会不会有疑惑,疑惑异常数据都是不好的吗?
不是的。还是要看问题的,当我们在信用卡欺诈,数据中我们往往找的就是异常数据。
那我们怎么能预测出来呢?
(1)3σ原则
(2)箱线图
(3)聚类(有时间再补充)
一、3σ原则
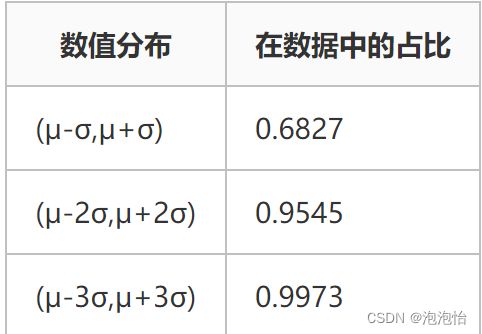
3σ原则假设一组检测数据含有随机误差,数据进行计算处理得到标准差,按概率函数确定一个区间,认为误差超过这个区间的就属于异常值。
正态分布:
代码:
import pandas as pd
import numpy as np
def three_sigma(Ser):
    rule = (Ser.mean()-3*Ser.std()>Ser1) | (Ser.mean()+3*Ser.std()< Ser)
    index = np.arange(Ser1.shape[0])[rule]
    outrange = Ser.iloc[index]
    return outrange
二、箱线图
箱型图提供了识别异常值的标准,异常值通常被定义为小于QL-1.5IQR或大于QU+1.5IQR的数据。QL称为下四分位数,表示全部值中有四分之一的数据取值比它小;QU称为上四分位数,表示全部值中有四分之一的数据取值比它大;IQR称为四分位数间距,是上四分位数QU与下四分位数QL之差。
1.函数一:对给定的某列Series进行异常值检测,并用不包括异常值的剩余数据的均值替换(Ser:进行异常值分析的DataFrame的某一列)
#定义箱线图识别异常值函数
def box——mean(Ser,Low=None,Up=None):
    if Low is None:
        Low=Ser.quantile(0.25)-1.5*(Ser.quantile(0.75)-Ser.quantile(0.25))
    if Up is None:
        Up=Ser.quantile(0.75)+1.5*(Ser.quantile(0.75)-Ser.quantile(0.25))
    Ser2=Ser[(Ser>=Low) & (Ser<=Up)]   #取出不包含异常点的数据,为了求均值
    Ser[(SerUp)]=Ser2.mean()  #用非空且非异常数据的那些数据的均值替换异常值
    return(Ser)
2.测试;
cols=[ 'chwrhdr', 'chwshdr', 'chwsfhdr', 'cwshdr', 'cwrhdr','dch']
for col_name in cols:
    data[col_name]=box_mean(data[col_name])
3.函数二:获取异常点索引号(Ser:进行异常值分析的DataFrame的某一列)
def outlier_index(Ser,Low=None,Up=None):
    if Low is None:
         Low = Ser.quantile(0.25)-1.5*(Ser.quantile(0.75)-Ser.quantile(0.25))
    if Up is None:
         Up = Ser.quantile(0.75)+1.5*(Ser.quantile(0.75)-Ser.quantile(0.25))
    yczindex_list=Ser[(SerUp)].index.tolist()
return(yczindex_list) 4.测试:删除DataFrame中某列有异常值的整行
for col_name in outlier_cols:
    yczindex_list=outlier_index(selfdata[col_name])
    selfdata=selfdata.drop(yczindex_list,axis=0)
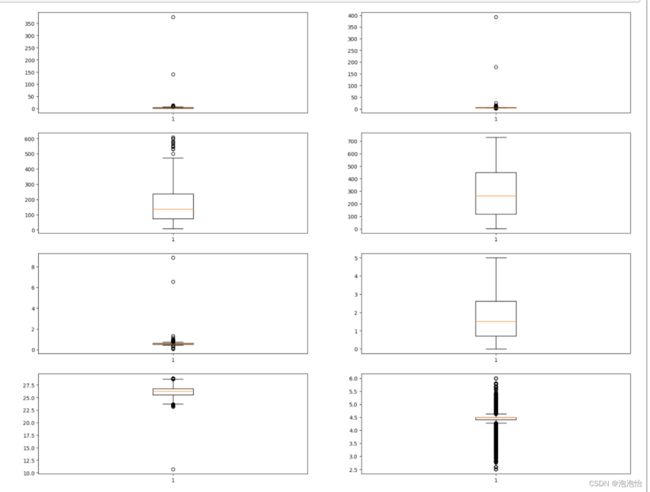
三、箱线图可视化(数值型特征)
numeric_cols=['chwgpmrt', 'cwgpmrt', 'systotpower', 'loadsys',
       'effsys', 'hbsys', 'wetbulb', 'cwgpmrt_sp']  #给出数值型特征的列名
col_numbers=len(numeric_cols)    #数值型特征列的个数
pic_numbers_per_line=2 #每行显示的图形个数
row_numbers=col_numbers//pic_numbers_per_line   #总共显示几行图形
plt.figure(figsize=(20,16),dpi=100)
for i in range(col_numbers):
    plt.subplot(row_numbers,pic_numbers_per_line,i+1)
    plt.boxplot(data[numeric_cols[i]])
plt.show()
结果:
在箱子外面的就是异常点。

