Python数据清洗与可视化——北京租房数据统计分析05
北京租房数据统计分析
5.1数据的爬取
代码:
# 5北京租房数据统计分析
# 5.1数据的爬取
import pandas as pd
import numpy as np
file_path=open(r"D:\python课设\数据\数据\5、北京租房数据统计分析\链家北京租房数据.csv")
file_data=pd.read_csv(file_path,encoding="utf-8")
file_data
运行结果:
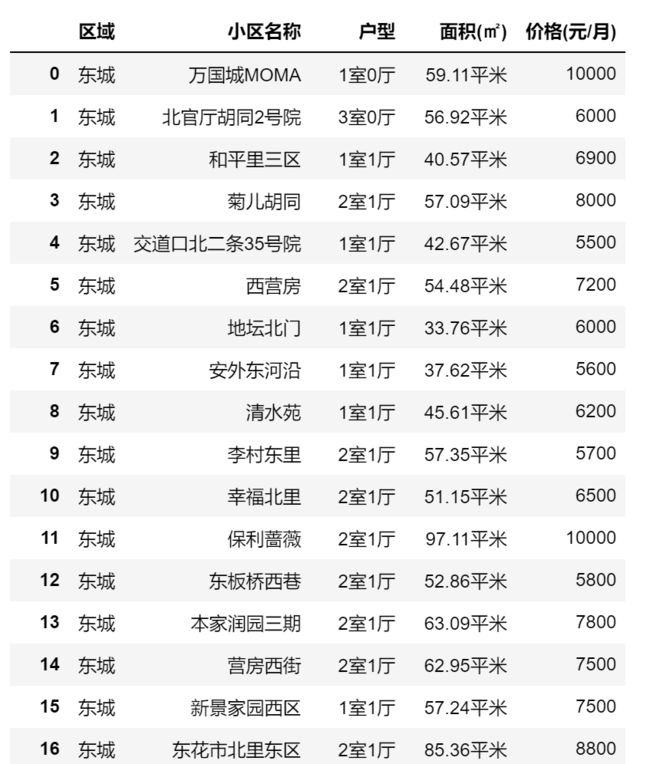
首先使用pandas的read_csv()方法进行数据的读取,然后就能够看到相应的表格信息。
5.2区域的房源总量的热力图分析
5.2.1数据去重:
代码:
# 先做数据预处理
file_data.duplicated()
运行结果:
先做数据预处理,将重复的数据做去重处理,我们可以看到使用duplicated()可以返回一组布尔数组,重复的部分返回值为FALSE,不重复的为True。
代码:
filed_data=file_data.drop_duplicates()
filed_data
运行结果:
使用drop_duplicates()方法对数据做去重处理,去除重复的数据,方便后面绘图计算以及其他操作。
5.2.2去除重复值
代码:
# 删除缺失的数据
data=filed_data.dropna()
data
运行结果:
使用dropna()的方法删除空值,做数据进一步的处理,方便后面绘图计算以及其他操作。
5.2.3数据类型的转化
代码:
# 刚我搞完了AK码的申请,现在我开始进行后面的数据处理,由于我们在这里,存在着热图查看需要准确经纬度
# 位置所以需要在这里把详细的部分做数据拼接
data["位置"]="北京市"+data["区域"].values+"区"+data["小区名称"].values
data
运行结果:
在这里显示热力图需要调用百度地图的API,就需要我们申请一个AK码,方便调用,然后还需要我们提供特别需要显示的经纬度。
这个地方比较复杂,所以我将会在另一篇博客中详细的论述这个部分的内容。
5.2.4导出热力图经纬度
代码:
# _*_ coding:utf-8 _*_
import requests
import pandas as pd
import time
import json


class LngLat:
    # def __init__(self):
    #     self.headers = {
    #         "User-Agent": "Mozilla/5.0 (Macintosh; Intel Mac OS X 10_13_0) AppleWebKit/537.36 (KHTML, like Gecko) Chrome/61.0.3163.100 Safari/537.36"}
    #     self.proxies = {
    #         "http": "http://61.135.217.7:80",
    #         "http": "http://118.190.95.43:9001",
    #         "http": "http://180.122.147.67:37153",
    #         "http": "http://118.190.95.35:9001",
    #         "http": "http://119.5.0.11:808",
    #         "http": "http://106.56.102.192:8070"
    #     }

    # 读取数据
    def read_data(self):
        file_path=open(r"D:\python课设\数据\数据\5、北京租房数据统计分析\链家北京租房数据.csv")
        file_data = pd.read_csv(file_path)
        duplicate_removal = file_data.drop_duplicates()
        house_names = duplicate_removal['位置']
        house_names = house_names.tolist()
        return house_names

    def get_url(self):
        url_temp = "http://api.map.baidu.com/geocoder/v2/?address={}&output=json&ak=NnQokv12fkyf4YoG59j9fRbGq4G8Lb4K&callback=showLocation"
        # ak = 'NnQokv12fkyf4YoG59j9fRbGq4G8Lb4K'
        house_names = self.read_data()
        return [url_temp.format(i) for i in house_names]

    # 发送请求
    def parse_url(self, url):
        while 1:
            try:
                r = requests.get(url)
            except requests.exceptions.ConnectionError:
                time.sleep(2)
                continue
            return r.content.decode('utf-8')

    def run(self):
        li = []
        urls = self.get_url()
        for url in urls:
            data = self.parse_url(url)
            str = data.split("{")[-1].split("}")[0]
            try:
                lng = float(str.split(",")[0].split(":")[1])
                lat = float(str.split(",")[1].split(":")[1])
            except ValueError:
                continue
                # 构建字典
            dict_data = dict(lng=lng, lat=lat, count=1)
            li.append(dict_data)
        f = open(r"D:\python课设\经纬度信息.txt",'w', 'w')
        f.write(json.dumps(li))
        f.close()
        print('写入成功')

if __name__ == '__main__':
    execute = LngLat()
    execute.run()
运行结果:
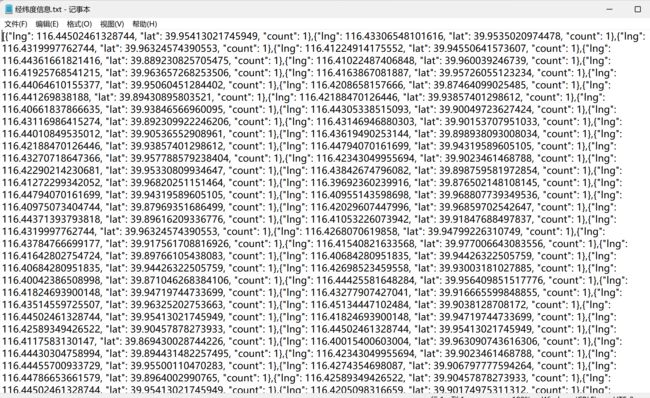
首先读取链家北京租房数据.csv的数据,位置信息获取,然后使用request获取相关的经纬度信息,然后将处理好的经纬度数据写入到txt文件中方便后面进行热力图的绘制。
5.2.5 热力图绘制
代码:
<!DOCTYPE html>
<html>

<head>
    <meta http-equiv="Content-Type" content="text/html; charset=utf-8" />
    <meta name="viewport" content="initial-scale=1.0, user-scalable=no" />
    <script type="text/javascript" src="http://api.map.baidu.com/api?v=2.0&ak=eYTWvbz8Z1lszcRQWrkbOB6RQQOEsDlC"></script>
    <script type="text/javascript" src="http://api.map.baidu.com/library/Heatmap/2.0/src/Heatmap_min.js"></script>
    <script src="https://code.jquery.com/jquery-3.3.1.min.js"></script>
    <title>热力图功能示例</title>
    <style type="text/css">
        ul,
        li {
            list-style: none;
            margin: 0;
            padding: 0;
            float: left;
        }

        html {
            height: 100%
        }

        body {
            height: 100%;
            margin: 0px;
            padding: 0px;
            font-family: "微软雅黑";
        }

        #container {
            height: 800px;
            width: 100%;
        }

        #r-result {
            width: 100%;
        }
    </style>
</head>

<body>
    <div id="container"></div>
    <div id="r-result">
        上传文件 : <input type="file" name="file" multiple id="fileId" />
        <button type="submit" name="btn" value="提交" id="btn1" onclick="check()">提交</button>
        <input type="button" onclick="openHeatmap();" value="显示热力图" /><input type="button" onclick="closeHeatmap();"
            value="关闭热力图" />
    </div>
</body>

</html>
<script type="text/javascript">


    var points = [];

    function check() {
        var objFile = document.getElementById("fileId");
        if (objFile.value == "") {
            alert("不能空")
        }
        var files = $('#fileId').prop('files'); //获取到文件列表
        console.log(files.length);
        if (files.length == 0) {
            alert('请选择文件');
        } else {
            for (var i = 0; f = files[i]; i++) {
                var reader = new FileReader(); //新建一个FileReader
                reader.readAsText(files[i], "UTF-8"); //读取文件
                reader.onload = function (evt) { //读取完文件之后会回来这里
                    points = jQuery.parseJSON(evt.target.result);
                }
            }
        }
    }


    var map = new BMap.Map("container");          // 创建地图实例

    var point = new BMap.Point(116.418261, 39.921984);
    map.centerAndZoom(point, 12);             // 初始化地图,设置中心点坐标和地图级别
    map.enableScrollWheelZoom(); // 允许滚轮缩放

    if (!isSupportCanvas()) {
        alert('热力图目前只支持有canvas支持的浏览器,您所使用的浏览器不能使用热力图功能~')
    }
    //详细的参数,可以查看heatmap.js的文档 https://github.com/pa7/heatmap.js/blob/master/README.md
    //参数说明如下:
	/* visible 热力图是否显示,默认为true
     * opacity 热力的透明度,1-100
     * radius 势力图的每个点的半径大小
     * gradient  {JSON} 热力图的渐变区间 . gradient如下所示
     *	{
			.2:'rgb(0, 255, 255)',
			.5:'rgb(0, 110, 255)',
			.8:'rgb(100, 0, 255)'
		}
		其中 key 表示插值的位置, 0~1.
		    value 为颜色值.
     */
    heatmapOverlay = new BMapLib.HeatmapOverlay({ "radius": 20 });
    map.addOverlay(heatmapOverlay);
    heatmapOverlay.setDataSet({ data: points, max: 15 });
    //是否显示热力图
    function openHeatmap() {
        heatmapOverlay.setDataSet({ data: points, max: 15 });
        heatmapOverlay.show();
    }
    function closeHeatmap() {
        heatmapOverlay.hide();
    }
    closeHeatmap();
    function setGradient() {
        /*格式如下所示:
      {
              0:'rgb(102, 255, 0)',
                .5:'rgb(255, 170, 0)',
              1:'rgb(255, 0, 0)'
      }*/
        var gradient = {};
        var colors = document.querySelectorAll("input[type='color']");
        colors = [].slice.call(colors, 0);
        colors.forEach(function (ele) {
            gradient[ele.getAttribute("data-key")] = ele.value;
        });
        heatmapOverlay.setOptions({ "gradient": gradient });
    }
    //判断浏览区是否支持canvas
    function isSupportCanvas() {
        var elem = document.createElement('canvas');
        return !!(elem.getContext && elem.getContext('2d'));
    }
</script>
运行结果:
[外链图片转存失败,源站可能有防盗链机制,建议将图片保存下来直接上传(img-FXPz7EQG-1640703659534)(https://gitee.com/wu-xiaofang/image/raw/master/202112282115879.png)]
- https://lbsyun.baidu.com/jsdemo.htm#c1_15进入这个网址,然后我们将里面的绘制代码copy下来进行修改,需要自行加入读入经纬度文件的部分,修改经纬度读取的point经纬度坐标点;
- 需要修改这里的AK码,方便对百度API的调用。
5.3 户型数量和欢迎度的条形图分析
5.3.1做户型数量分析
代码:
# 5.3 户型数量和欢迎度的条形图分析
# 先进行户型的数量分析
import numpy as np
def all_house(arr):
    arr=np.array(arr)
    key=np.unique(arr)
    result={}
    for k in key:
        mask=(arr==k)
        arr_new=arr[mask]
        v=arr_new.size
        result[k]=v
    return result
# 获取用户户型数据
house_array=file_data["户型"]
house_info=all_house(house_array)
house_info
运行结果:
进行户型的数量分析,使用 key=np.unique(arr),获取不同的户型数据集,然后定义函数对户型进行分组,定义一个字典储存分类好的数据,键是户型,值是户型的数量,最后调用函数,对户型进行数据的处理。
5.3.2使用字典推导处理dataframe
代码:
# 使用字典推导
house_type=dict((key,value)for key,value in house_info.items()if value>50)
show_house=pd.DataFrame({"户型":[x for x in house_type.keys()],
                         "数量":[x for x in house_type.values()]})
show_house
运行结果:
对户型数量>50的数据进行字典推导式,使用字典推导式来快速的生成一个字典,生成一个户型以及数量对应的字典,然后将这些数据再解析生成一个DataFrame对象,方便后面做数据的可视化。
5.3.3条形图绘制户型数据
代码:
# 使用条形图将户型数据做展示

import matplotlib.pyplot as plt
import matplotlib

matplotlib.rcParams['font.sans-serif'] = ['SimHei']
matplotlib.rcParams['axes.unicode_minus'] = False

house_type=show_house["户型"]
house_type_nums=show_house["数量"]
house_type_nums
"""
绘制水平条形图方法barh
参数一:y轴
参数二:x轴
"""
plt.barh(range(13), house_type_nums, height=0.7, color='steelblue', alpha=0.8)      # 从下往上画
plt.yticks(range(13), house_type)
plt.xlim(0,2700)
plt.xlabel("数量")
plt.title("户型数据")
for x, y in enumerate(house_type_nums):
    plt.text(y + 0.2, x - 0.1, '%s' % y)
plt.show()
运行结果:
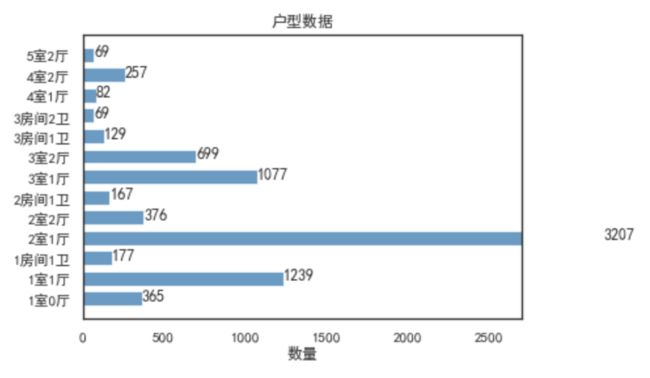
绘制条形图:
pyplot并不默认支持中文显示,需要rcParams修改字体来实现
记得添加上
matplotlib.rcParams['font.sans-serif'] = ['SimHei']
matplotlib.rcParams['axes.unicode_minus'] = False
防止乱码,同时还需要添加上这两个关于文字显示,第一个是用来正常显示中文标签,第二个是用来正常显示正负标签。
5.4各区域的房源数量和租金情况的柱状图和折线图分析
5.4.1计算平均租金
-
创建新列
代码:
# 平均租金分析
# 计算平均租金
df_all=pd.DataFrame({"区域":data["区域"].unique(),
                   '房租总金额':[0]*13,
                   "总面积(m平方)":[0]*13})
df_all
运行结果:
-
添加列值
代码:
sum_price=data["价格(元/月)"].groupby(file_data["区域"]).sum()
sum_area=data["面积(㎡)"].groupby(file_data["区域"]).sum()
# 将值添加进来
df_all["房租总金额"]=sum_price.values
df_all["总面积(m平方)"]=sum_area.values
df_all
运行结果:
-
计算每平米租金
代码:
# 定义函数计算每平米的租金
df_all["每平米租金"]=round(df_all["房租总金额"]/df_all["总面积(m平方)"],2)
# 计算并且保留两位小数
df_allSS
运行结果:
-
合并房源数据
代码:
# 合并房源数据以及我们的租金数据
df_merge=pd.merge(df_all,homes)
df_merge
运行结果:
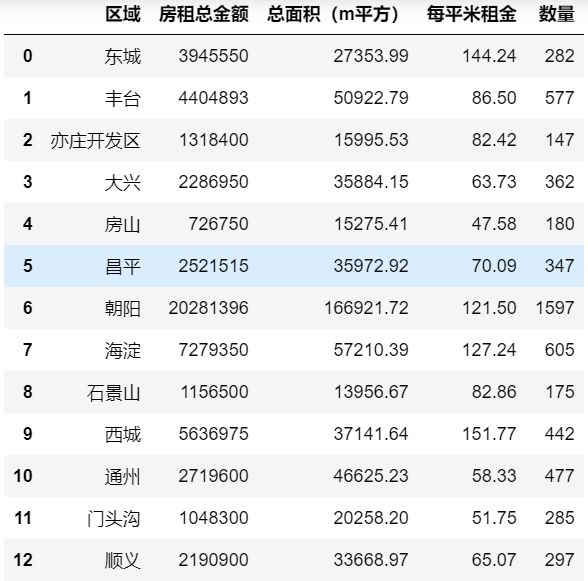
先添加两列为后面加数据列做准备计算房租总金额以及总面积最后定义函数计算每平米的租金,合并房源数据以及我们的租金数据,就可以得到各区域完整的房源数据。
5.4.2 各区域的房源数量和租金情况的柱状图和折线图分析
代码:
# 5.4各区域的房源数量和租金情况的柱状图和折线图分析

import matplotlib.ticker as mtick
from matplotlib.font_manager import FontProperties
num=df_merge['数量']
price=df_merge['每平米租金']
l=[i for i in range(13)]
plt.rcParams['font.sans-serif']=['SimHei']
lx=df_merge['区域']
fig=plt.figure()
ax1=fig.add_subplot(111)
ax1.plot(l,price,'or-',label='价格')
for i,(_x,_y) in enumerate(zip(l,price)):
    plt.text(_x,_y,price[i],color='black',fontsize=10,rotation=30)
ax1.set_ylim([0,200])
ax1.set_ylabel('价格')
plt.legend(prop={'family':'SimHei','size':8},loc='upper left')
ax2=ax1.twinx()
plt.bar(l,num,alpha=0.3,color='green',label='数量')
ax2.set_ylabel('数量')
ax2.set_ylim([0,2000])
plt.legend(prop={'family':'SimHei','size':8},loc='upper right')
plt.xticks(l,lx)
plt.xticks(rotation=0.3)
plt.show()
运行结果:
-
在这里将enumerate,zip函数的结合使用:
在这里可以看到i与_x均是索引值,用来表示表示坐标值上的值,y则是每平米的租金
-
enumerate函数:遍历一个序列的同时追踪当前元素的索引。
-
zip 将列表,元祖或其他序列的元素配对,新建一个元祖构成的列表
2.plt.text()函数用于设置文字说明。
plt.text(x,
	y,
	string,
	fontsize=15,
	verticalalignment="top",
	horizontalalignment="right"
)
-
x,y:表示坐标值上的值
-
string:表示说明文字
-
fontsize:表示字体大小
-
verticalalignment:垂直对齐方式 ,参数:[ ‘center’ | ‘top’ | ‘bottom’ | ‘baseline’ ]
-
horizontalalignment:水平对齐方式 ,参数:[ ‘center’ | ‘right’ | ‘left’ ]
5.5面积区间的市场占有率的饼状图分析
5.5.1面积区间分析
代码:
# 5.5面积区间的市场占有率的饼状图分析
# 面积区间分析
print("房屋最大面积为%d㎡"%(data["面积(㎡)"].max()))
print("房屋最小面积为%d㎡"%(data["面积(㎡)"].min()))
# 最高值,最小值
print("房屋最高值为%d(元/月)"%(data["价格(元/月)"].max()))
print("房屋最小值为%d(元/月)"%(data["价格(元/月)"].min()))
运行结果:
使用min(),max()函数求最大最小值。
5.5.2数据预处理
代码:
area_divide=[1,30,50,70,90,120,140,160,1200]
area_cut=pd.cut(list(data["面积(㎡)"]),area_divide)
area_cut_data=area_cut.describe()
area_cut_data
# =area_cut_data.dropna()
运行结果:
使用pandas.cut进行数据的分箱操作,将这里完整的租房数据分割成为离散的区间。按照这个集合[1,30,50,70,90,120,140,160,1200]进行数据的划分。
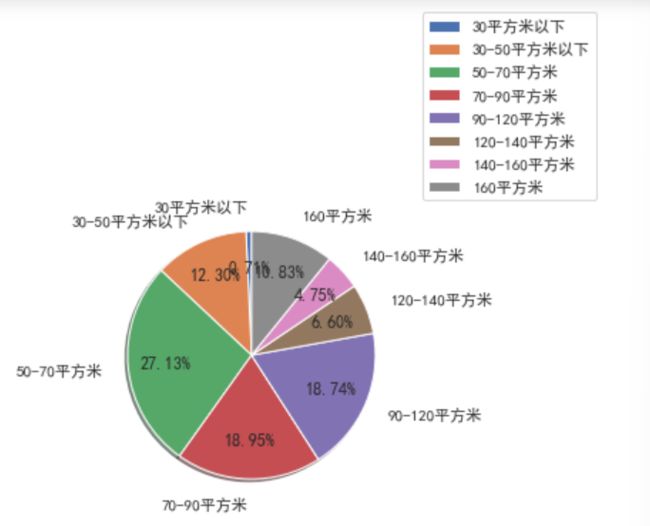
5.5.3绘制饼状图
代码:
import numpy as np
area_percentage=(area_cut_data["freqs"].values)*100
np.set_printoptions(precision=2)
lables=['30平方米以下','30-50平方米以下','50-70平方米','70-90平方米','90-120平方米','120-140平方米','140-160平方米','160平方米']
plt.axes(aspect=1)
plt.pie(x=area_percentage,labels=lables,autopct='%.2f%%',shadow=True,labeldistance=1.2,startangle=90,pctdistance=0.7)
# 图例放在图标位置
plt.legend(bbox_to_anchor=(1.05, 1), loc=3, borderaxespad=0.)
plt.show()
运行结果:
numpy.set_printoptions()
参数:
numpy.set_printoptions(precision=None,
						threshold=None,
						edgeitems=None,
						linewidth=None,
						suppress=None,
						nanstr=None,
						infstr=None,
						formatter=None
				)[source]
参数:
-
precision:int,可选,浮点数输出的精度位数(默认为8)。
-
阈值:int,可选,触发汇总而不是完全repr的数组元素的总数(默认为1000)。
-
edgeitems:int,可选,在每个维度的开始和结束处的摘要中的数组项数(默认值为3)。
-
linewidth:int,可选,用于插入换行符的每行字符数(默认为75)。
-
suppress:bool,可选,是否使用科学计数法抑制小浮点值的打印(默认值为False)。
-
nanstr:str,可选,浮点数的字符串表示不是数字(默认为nan)。
-
infstr:str,可选,浮点无穷大的字符串表示形式(默认inf)。
-
格式化程序:可调用的dict,可选,如果不是无,键应该指示相应格式化功能应用的类型。Callables应该返回一个字符串。未指定的类型(通过其相应的键)由默认格式化程序处理。可以设置格式化程序的单个类型有:
-
- ‘bool’
- ‘int’
- ‘timedelta’ : a
numpy.timedelta64 - ‘datetime’ : a
numpy.datetime64 - ‘float’
- ‘longfloat’ : 128-bit floats
- ‘complexfloat’
- ‘longcomplexfloat’ : composed of two 128-bit floats
- ‘numpy_str’ : types
numpy.string_andnumpy.unicode_ - ‘str’ : all other strings
-
可用于一次设置一组类型的其他键有:
-
‘all’ : sets all types
-
‘int_kind’ : sets ‘int’
-
‘float_kind’ : sets ‘float’ and ‘longfloat’
-
‘complex_kind’ : sets ‘complexfloat’ and ‘longcomplexfloat’
-
‘str_kind’ : sets ‘str’ and ‘numpystr’
-
pyplot.pie
绘制饼图
matplotlib.pyplot.pie(
        x, explode=None, labels=None, colors=None, autopct=None,
        pctdistance=0.6, shadow=False, labeldistance=1.1,
        startangle=None, radius=None, counterclock=True,
        wedgeprops=None, textprops=None, center=(0, 0), frame=False,
        rotatelabels=False, *, data=None)
参数解析:
x: 传入的数据explode:默认x的饼图不爆炸。自定义确定哪一块爆炸&爆炸距离。labels和labeldistance: 默认x没有标签,标签位于1.1倍半径处。自定义每块饼的标签,和位置。autopct和pctdistance: 默认x不显示每块饼的百分比标注。autopct自定义是每块饼的百分比属性,如几位小数,pctdistance默认在半径0.6位置显示百分数,自定义百分数距离半径的比例。shadow: 默认x是二维平面饼图,没有阴影。自定义饼图是否有阴影属性。startangle: 默认x第一块饼和水平面的角度不固定。自定义第一块饼图和水平面的角度。
加的这一句是为了防止图例和图标重合,
plt.legend(bbox_to_anchor=(1.05, 1), loc=3, borderaxespad=0.)
bbox_to_anchor关键字可让用户手动控制图例布局,给一个定位坐标用于定位legend box 放置的地方;- legend 里面使用 loc 这个参数来设置我们的摆放的位置,横坐标为3;
- borderaxespad用来调节轴和图例边框之间的间距。 以字体大小为单位度量。 默认值为
None,它将legend.borderaxespad rcParam中获取值。
=False, *, data=None)
饼图绘制就完成了。
