pandas tutorials官方教程上
个人学习笔记方便查询
来源:Getting started tutorials
五个知识点:
- pandas库处理什么类型的数据
- 怎么读取和存储数据
- 如何选择DataFrame子集
- 如何在pandas里绘图
- 如何从已有的列创建新列
(一)pandas库处理什么类型的数据
import pandas as pd
1.pandas数据表
DataFrame:一个二维的数据结构,能存储不同类型的数据(整数,浮点数,类别)
例如存储Titanic的乘客数据,包含名字(字符串),年龄(整数),性别。使用DataFrame创建数据表有三列,列名分别为Name ,Age ,Sex。创建时使用字典。
>>> import pandas as pd
>>> df = pd.DataFrame(
	    { "Name": [ "Braund, Mr. Owen Harris","Allen, Mr. William Henry","Bonnell, Miss. Elizabeth"],
          "Age": [22, 35, 58],
          "Sex": ["male", "male", "female"]})
>>> df
                       Name  Age     Sex
0   Braund, Mr. Owen Harris   22    male
1  Allen, Mr. William Henry   35    male
2  Bonnell, Miss. Elizabeth   58  female
2.DataFrame每列都是Series
查看Age列的数据,返回一个Series
>>> df['Age']
0    22
1    35
2    58
Name: Age, dtype: int64
创建Series
>>> ages = pd.Series([22,35,58], name='Age')
>>> ages
0    22
1    35
2    58
Name: Age, dtype: int64
Series没有列标签,只是DataFrame中的某列,但是有行标签
3.DataFrame或者Series操作
想要知道乘客年龄最大值,执行max()操作
>>> df['Age'].max()
58
>>> ages.max()
58
想要知道数据的统计值,Name 和Sex是文本数据,无统计值
>>> df.describe()
             Age
count   3.000000
mean   38.333333
std    18.230012
min    22.000000
25%    28.500000
50%    35.000000
75%    46.500000
max    58.000000
(二)怎么读取和存储数据
1.读数据read

读取Titanic乘客数据,存储在一个CSV文件中。其它格式的文件(csv,excel,sql,json,parquet)都可以读取,格式read_*。默认显示前后5行
>>> titanic = pd.read_csv('/Users/bujibujibiu/Desktop/train.csv')
>>> titanic
     PassengerId  Survived  Pclass  ...     Fare Cabin  Embarked
0              1         0       3  ...   7.2500   NaN         S
1              2         1       1  ...  71.2833   C85         C
2              3         1       3  ...   7.9250   NaN         S
3              4         1       1  ...  53.1000  C123         S
4              5         0       3  ...   8.0500   NaN         S
..           ...       ...     ...  ...      ...   ...       ...
886          887         0       2  ...  13.0000   NaN         S
887          888         1       1  ...  30.0000   B42         S
888          889         0       3  ...  23.4500   NaN         S
889          890         1       1  ...  30.0000  C148         C
890          891         0       3  ...   7.7500   NaN         Q

[891 rows x 12 columns]
指定显示的行,head()和tail()
>>> titanic.head(8)
   PassengerId  Survived  Pclass  ...     Fare Cabin  Embarked
0            1         0       3  ...   7.2500   NaN         S
1            2         1       1  ...  71.2833   C85         C
2            3         1       3  ...   7.9250   NaN         S
3            4         1       1  ...  53.1000  C123         S
4            5         0       3  ...   8.0500   NaN         S
5            6         0       3  ...   8.4583   NaN         Q
6            7         0       1  ...  51.8625   E46         S
7            8         0       3  ...  21.0750   NaN         S

[8 rows x 12 columns]
>>> titanic.tail(8)
     PassengerId  Survived  Pclass  ...    Fare Cabin  Embarked
883          884         0       2  ...  10.500   NaN         S
884          885         0       3  ...   7.050   NaN         S
885          886         0       3  ...  29.125   NaN         Q
886          887         0       2  ...  13.000   NaN         S
887          888         1       1  ...  30.000   B42         S
888          889         0       3  ...  23.450   NaN         S
889          890         1       1  ...  30.000  C148         C
890          891         0       3  ...   7.750   NaN         Q

[8 rows x 12 columns]
查看数据类型
>>> titanic.dtypes
PassengerId      int64
Survived         int64
Pclass           int64
Name            object
Sex             object
Age            float64
SibSp            int64
Parch            int64
Ticket          object
Fare           float64
Cabin           object
Embarked        object
dtype: object
2.存数据to
>>> titanic.to_excel('/Users/bujibujibiu/Desktop/titanic.xlsx', sheet_name='passengers', index=False)
read_*是读数据到pandas,to_*是存储数据到文件里,sheet_name修改表单的名字,默认是Sheet1,index=False不存储行标签,打开titanic.xlsx
>>> titanic = pd.read_excel('/Users/bujibujibiu/Desktop/titanic.xlsx', sheet_name='passengers')
>>> titanic.head()
   PassengerId  Survived  Pclass  ...     Fare Cabin  Embarked
0            1         0       3  ...   7.2500   NaN         S
1            2         1       1  ...  71.2833   C85         C
2            3         1       3  ...   7.9250   NaN         S
3            4         1       1  ...  53.1000  C123         S
4            5         0       3  ...   8.0500   NaN         S

[5 rows x 12 columns]
获取DataFrame的整体信息
>>> titanic.info()
<class 'pandas.core.frame.DataFrame'>
RangeIndex: 891 entries, 0 to 890
Data columns (total 12 columns):
 #   Column       Non-Null Count  Dtype
---  ------       --------------  -----
 0   PassengerId  891 non-null    int64
 1   Survived     891 non-null    int64
 2   Pclass       891 non-null    int64
 3   Name         891 non-null    object
 4   Sex          891 non-null    object
 5   Age          714 non-null    float64
 6   SibSp        891 non-null    int64
 7   Parch        891 non-null    int64
 8   Ticket       891 non-null    object
 9   Fare         891 non-null    float64
 10  Cabin        204 non-null    object
 11  Embarked     889 non-null    object
dtypes: float64(2), int64(5), object(5)
memory usage: 83.7+ KB
(三)如何选择DataFrame子集
1.选择特定的列
>>> ages = titanic['Age']
>>> ages.head()
0    22.0
1    38.0
2    26.0
3    35.0
4    35.0
Name: Age, dtype: float64
列的类型
>>> type(ages)
<class 'pandas.core.series.Series'>
列的形状
>>> ages.shape
(891,)
同时选择多列:年龄和性别
>>> age_sex = titanic[['Age','Sex']]
>>> age_sex.head()
    Age     Sex
0  22.0    male
1  38.0  female
2  26.0  female
3  35.0  female
4  35.0    male
>>> age_sex.shape
(891, 2)
2.过滤指定的行
>>> above_35 = titanic[titanic['Age']>35]
>>> above_35.head()
    PassengerId  Survived  Pclass  ...     Fare Cabin  Embarked
1             2         1       1  ...  71.2833   C85         C
6             7         0       1  ...  51.8625   E46         S
11           12         1       1  ...  26.5500  C103         S
13           14         0       3  ...  31.2750   NaN         S
15           16         1       2  ...  16.0000   NaN         S

[5 rows x 12 columns]
titanic['Age'] > 35判断年龄是否大于35,其它判断符号==,!=,<=,<,返回布尔值,放在[ ]中会返回True的行
>>> titanic['Age'] > 35
0      False
1       True
2      False
3      False
4      False
       ...
886    False
887    False
888    False
889    False
890    False
Name: Age, Length: 891, dtype: bool
选择在船仓2和3的乘客,isin用于判断每行的值是否在列表[2,3]中,与或操作|类似
>>> class_23 = titanic[titanic['Pclass'].isin([2,3])]
>>> class_23.head()
   PassengerId  Survived  Pclass  ...     Fare Cabin  Embarked
0            1         0       3  ...   7.2500   NaN         S
2            3         1       3  ...   7.9250   NaN         S
4            5         0       3  ...   8.0500   NaN         S
5            6         0       3  ...   8.4583   NaN         Q
7            8         0       3  ...  21.0750   NaN         S

[5 rows x 12 columns]
>>> class_23 = titanic[(titanic['Pclass'] == 2) | (titanic['Pclass'] == 3)]
选择年龄不是空值的数据,notna判断是否为空值
>>> age_no_na = titanic[titanic['Age'].notna()]
>>> age_no_na.head()
   PassengerId  Survived  Pclass  ...     Fare Cabin  Embarked
0            1         0       3  ...   7.2500   NaN         S
1            2         1       1  ...  71.2833   C85         C
2            3         1       3  ...   7.9250   NaN         S
3            4         1       1  ...  53.1000  C123         S
4            5         0       3  ...   8.0500   NaN         S

[5 rows x 12 columns]
3.选择指定的行和列
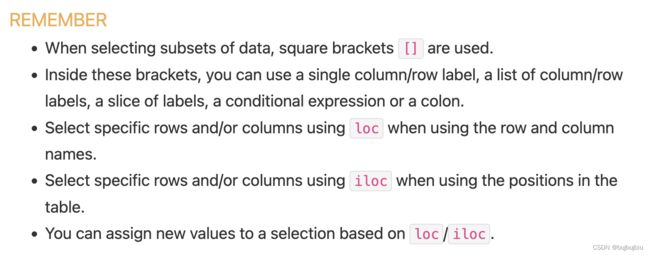
获取年龄大于35岁的乘客的名字,使用loc/iloc操作,前面是想要保留的行,后面的想要选择的列,如果使用列名,行标签,或者条件表达式用loc,如果是数字索引用iloc
>>> adult_names = titanic.loc[titanic['Age'] >35,'Name']
>>> adult_names.head()
1     Cumings, Mrs. John Bradley (Florence Briggs Th...
6                               McCarthy, Mr. Timothy J
11                             Bonnell, Miss. Elizabeth
13                          Andersson, Mr. Anders Johan
15                     Hewlett, Mrs. (Mary D Kingcome)
Name: Name, dtype: object
>>> titanic.iloc[5:9, 2:5]
   Pclass                                               Name     Sex
5       3                                   Moran, Mr. James    male
6       1                            McCarthy, Mr. Timothy J    male
7       3                     Palsson, Master. Gosta Leonard    male
8       3  Johnson, Mrs. Oscar W (Elisabeth Vilhelmina Berg)  female
通过loc/iloc赋新值
>>> titanic.iloc[0:3,3] = 'anonymous'
>>> titanic.head()
   PassengerId  Survived  Pclass  ...     Fare Cabin  Embarked
0            1         0       3  ...   7.2500   NaN         S
1            2         1       1  ...  71.2833   C85         C
2            3         1       3  ...   7.9250   NaN         S
3            4         1       1  ...  53.1000  C123         S
4            5         0       3  ...   8.0500   NaN         S

[5 rows x 12 columns]
(四)如何在pandas里绘图

需要先下载air_quality_no2.csv文件,在OpenAQ上开源,也可以直接去pandas github下载,github只能下载完整的文件,可以将链接https://github.com/pandas-dev/pandas/blob/main/doc/data/air_quality_no2.csv输入到DownGit单独下载

>>> air_quality = pd.read_csv('/Users/bujibujibiu/Desktop/air_quality_no2.csv', index_col=0, parse_dates=True)
>>> air_quality.head()
                     station_antwerp  station_paris  station_london
datetime
2019-05-07 02:00:00              NaN            NaN            23.0
2019-05-07 03:00:00             50.5           25.0            19.0
2019-05-07 04:00:00             45.0           27.7            19.0
2019-05-07 05:00:00              NaN           50.4            16.0
2019-05-07 06:00:00              NaN           61.9             NaN
index_col=0将第一列作为DataFrame的索引,parse_dates=True将列中的日期转换成 Timestamp类型
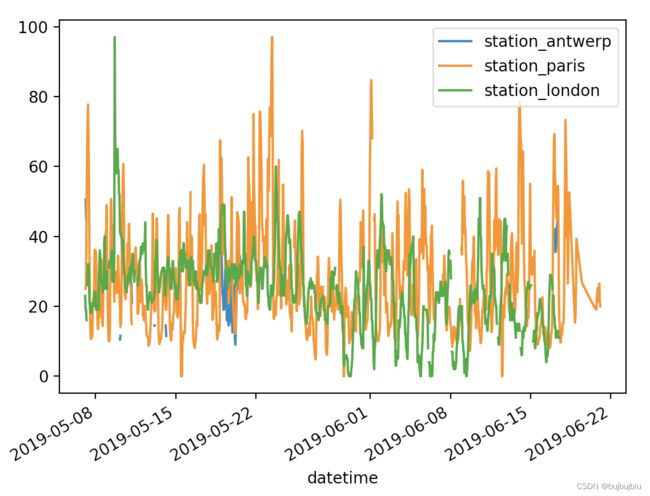
1.折线图
pandas会默认创建数据没列的折线图
>>> air_quality.plot()
<AxesSubplot:xlabel='datetime'>
>>> plt.show()
>>> air_quality['station_paris'].plot()
<AxesSubplot:xlabel='datetime'>
>>> plt.show()
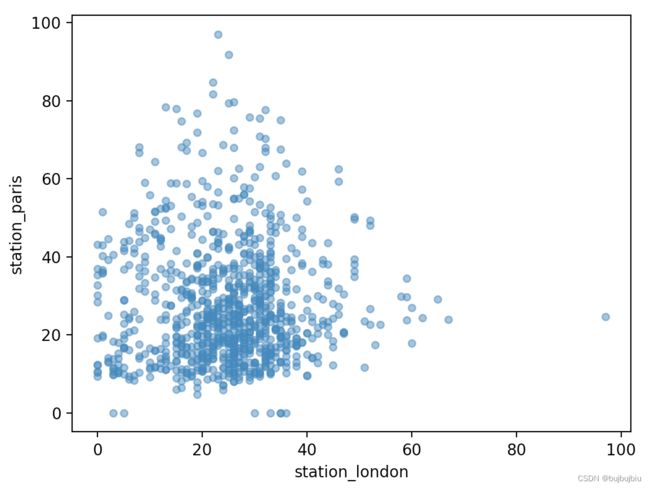
2.散点图
可视化London和Pairs的二氧化氮测量值对比图,alpha为不透明度,值为0时为透明状态,默认为1
>>> air_quality.plot.scatter(x='station_london', y='station_paris', alpha=0.5)
<AxesSubplot:xlabel='station_london', ylabel='station_paris'>
>>> plt.show()

除了scatter,还有许多其他图,用dir()显示,dir() 函数不带参数时,返回当前范围内的变量、方法和定义的类型列表;带参数时,返回参数的属性、方法列表。
>>> [method_name for method_name in dir(air_quality.plot) if not method_name.startswith("_")]
['area', 'bar', 'barh', 'box', 'density', 'hexbin', 'hist', 'kde', 'line', 'pie', 'scatter']
调用.plot.*()在Series和DataFrames都能用
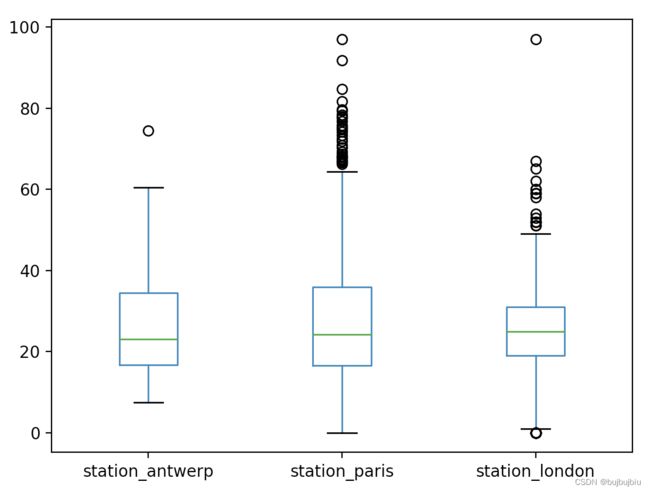
3.箱线图
使用DataFrame.plot.box()绘制箱线图
>>> air_quality.plot.box()
<AxesSubplot:>
>>> plt.show()
4.多图
想要数据每列在分开的子图里,使用subplots=True
>>> axs = air_quality.plot.area(figsize=(12, 4), subplots=True)
>>> plt.show()

如果想要自己设置图片,可以联合Matplotlib和pandas,每个由pandas创建的图都是Matplotlib对象
# 创建一个空的Matplotlib图像和坐标轴(Matplotlib Figure and Axes)
>>> fig, axs = plt.subplots(figsize=(12,4))
# 使用pandas将数据绘制在定义的图像或者坐标轴上
>>> air_quality.plot.area(ax=axs)
<AxesSubplot:xlabel='datetime'>
# 使用Matplotlib方法设置图片
>>> axs.set_ylabel('NO$_2$ concentration')
Text(0, 0.5, 'NO$_2$ concentration')
>>> fig.savefig('no2_concentrations.png')
>>> plt.show()
(五)如何从已有的列创建新列
1.创建新列
使用前面的空气质量数据,用mg/m3表示London得二氧化氮浓度,转化因子为1.882,创建新列直接使用[]加列名
>>> air_quality['london_mg_per_cubic'] = air_quality['station_london'] * 1.882
>>> air_quality.head()
                     station_antwerp  ...  london_mg_per_cubic
datetime                              ...
2019-05-07 02:00:00              NaN  ...               43.286
2019-05-07 03:00:00             50.5  ...               35.758
2019-05-07 04:00:00             45.0  ...               35.758
2019-05-07 05:00:00              NaN  ...               30.112
2019-05-07 06:00:00              NaN  ...                  NaN

[5 rows x 4 columns]
2.列运算
想要对比Paris和Antwerp并保存到新列
>>> air_quality["ratio_paris_antwerp"] = air_quality['station_paris']  / air_quality["station_antwerp"]
>>> air_quality.head()
                     station_antwerp  ...  ratio_paris_antwerp
datetime                              ...
2019-05-07 02:00:00              NaN  ...                  NaN
2019-05-07 03:00:00             50.5  ...             0.495050
2019-05-07 04:00:00             45.0  ...             0.615556
2019-05-07 05:00:00              NaN  ...                  NaN
2019-05-07 06:00:00              NaN  ...                  NaN

[5 rows x 5 columns]
列之间可以直接运算,其它数学操作符如+, -, *, /和逻辑操作符<, >, ==都能使用,如果想要更复杂的操作,使用apply()函数
3.修改列名
重新命名列使用rename(),rename()对行和列都适用,输入字典提供当前名字和修改的名字
>>> air_quality_renamed = air_quality.rename(columns={"station_antwerp": "BETR801","station_paris": "FR04014","station_london": "London Westminster"})
>>> air_quality_renamed.head()
                     BETR801  FR04014  ...  london_mg_per_cubic  ratio_paris_antwerp
datetime                               ...
2019-05-07 02:00:00      NaN      NaN  ...               43.286                  NaN
2019-05-07 03:00:00     50.5     25.0  ...               35.758             0.495050
2019-05-07 04:00:00     45.0     27.7  ...               35.758             0.615556
2019-05-07 05:00:00      NaN     50.4  ...               30.112                  NaN
2019-05-07 06:00:00      NaN     61.9  ...                  NaN                  NaN

[5 rows x 5 columns]
rename()也能实现函数的映射,如使用当前列名的小写
>>> air_quality_renamed = air_quality_renamed.rename(columns=str.lower)
>>> air_quality_renamed.head()
                     betr801  fr04014  ...  london_mg_per_cubic  ratio_paris_antwerp
datetime                               ...
2019-05-07 02:00:00      NaN      NaN  ...               43.286                  NaN
2019-05-07 03:00:00     50.5     25.0  ...               35.758             0.495050
2019-05-07 04:00:00     45.0     27.7  ...               35.758             0.615556
2019-05-07 05:00:00      NaN     50.4  ...               30.112                  NaN
2019-05-07 06:00:00      NaN     61.9  ...                  NaN                  NaN

[5 rows x 5 columns]


