12.集成学习进阶一——xgboost
xgboost算法
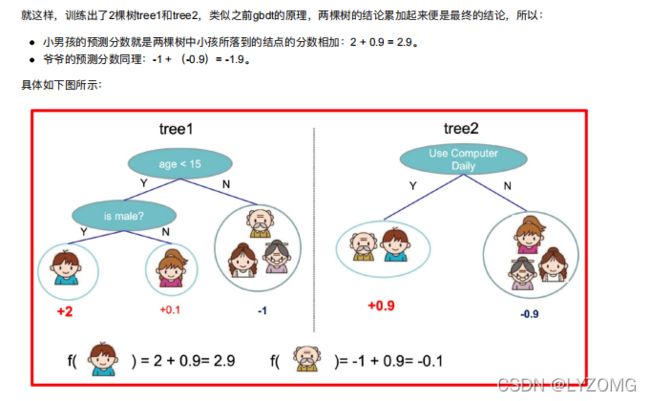
XGBoost(Extreme Gradient Boosting)全名叫极端梯度提升树,XGBoost是集成学习⽅法的王牌,在Kaggle数据挖掘 ⽐赛中,⼤部分获胜者⽤了XGBoost。
最优模型的构建⽅法
XGBoost的⽬标函数推导
⽬标函数确定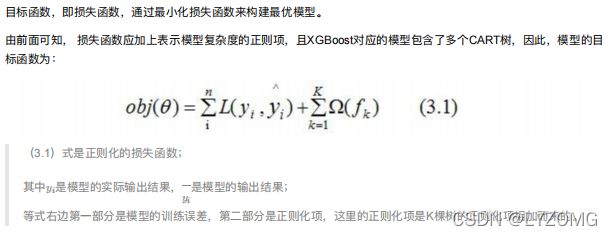
CART树的介绍
树的复杂度定义
定义每课树的复杂度
树的复杂度例子
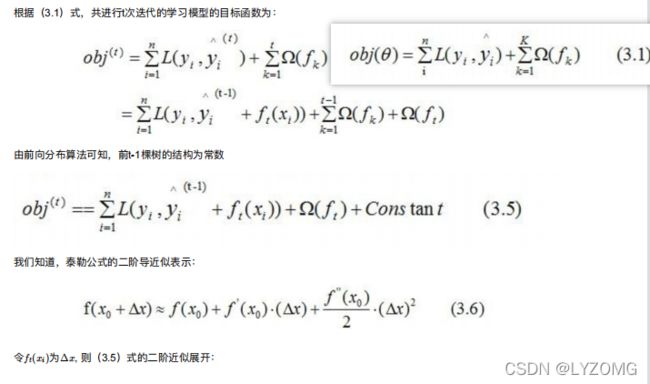
⽬标函数推导
XGBoost的回归树构建⽅法
计算分裂节点
停⽌分裂条件判断
XGBoost与GDBT的区别
xgboost算法api介绍
官网
pip3 install xgboost
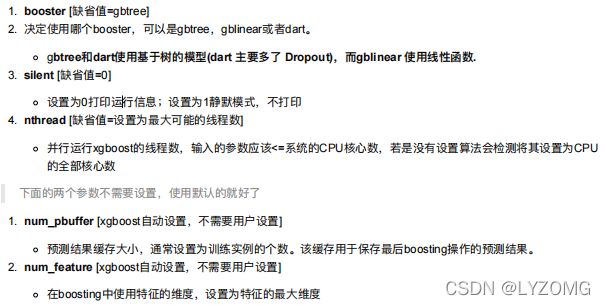
通⽤参数(general parameters)
Booster 参数(booster parameters)
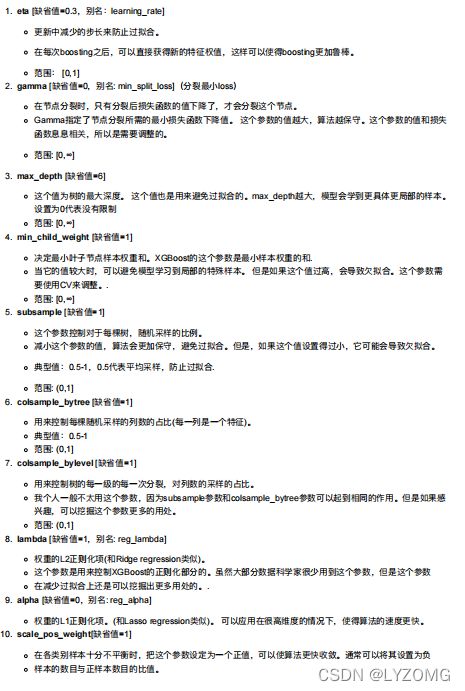
Parameters for Tree Booster
Parameters for Linear Booster
学习⽬标参数(task parameters)
xgboost案例–泰坦尼克号存活分析

案例
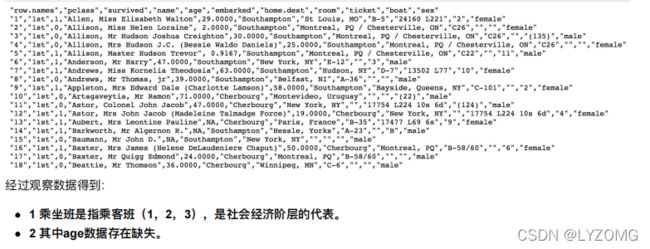
我们提取到的数据集中的特征包括票的类别,是否存活,乘坐班次,年龄,登陆home.dest,房间,船和性别等。
[数据](http://biostat.mc.vanderbilt.edu/wiki/pub/Main/DataSets/titanic.txt)
import pandas as pd
import numpy as np
from sklearn.model_selection import train_test_split
from sklearn.feature_extraction import DictVectorizer
from sklearn.tree import DecisionTreeClassifier, export_graphviz
# 1.获取数据
titan = pd.read_csv("http://biostat.mc.vanderbilt.edu/wiki/pub/Main/DataSets/titanic.txt")
titan
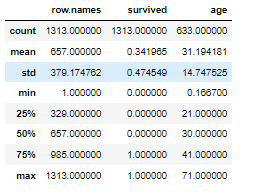
titan.describe()
# 2.数据基本处理
# 2.1 确定特征值,目标值
x = titan[["pclass", "age", "sex"]]
y = titan["survived"]
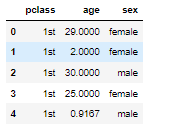
x.head()
y.head()
# 2.2 缺失值处理
x['age'].fillna(value=titan["age"].mean(), inplace=True)
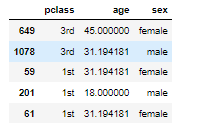
x.head()
# 2.3 数据集划分
x_train, x_test, y_train, y_test = train_test_split(x, y, random_state=22, test_size=0.2)
# 3.特征工程(字典特征抽取)
x_train.head()
x_train = x_train.to_dict(orient="records")
x_test = x_test.to_dict(orient="records")
x_train
transfer = DictVectorizer()

x_train = transfer.fit_transform(x_train)
x_test = transfer.fit_transform(x_test)
# 4.xgboost模型训练
# 4.1 初步模型训练
from xgboost import XGBClassifier
xg = XGBClassifier()
xg.fit(x_train, y_train)
xg.score(x_test, y_test) #0.7832699619771863
# 4.2 对max_depth进行调优

depth_range  = range(10)
score = []

for i in depth_range:
    xg = XGBClassifier(eta=1, gamma=0, max_depth=i)
    xg.fit(x_train, y_train)

    s = xg.score(x_test, y_test)

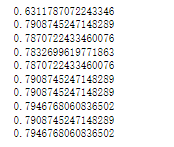
    print(s)
    score.append(s)
# 4.3 调优结果可视化
import matplotlib.pyplot as plt
plt.plot(depth_range, score)
plt.show()
xgboost案例–otto案例产品分类
import numpy as np
import pandas as pd
import matplotlib.pyplot as plt
数据获取
data = pd.read_csv("./data/otto/train.csv")
data.head()
data.shape #(61878, 95)
data.describe()
# 图形可视化,查看数据分布
import seaborn as sns

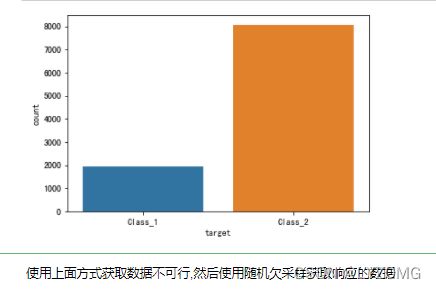
sns.countplot(data.target)

plt.show()
数据基本处理
数据已经经过脱敏,不再需要特殊处理
# 截取部分数据
new1_data = data[:10000]
new1_data.shape #(10000, 95)

# 图形可视化,查看数据分布
sns.countplot(new1_data.target)

plt.show()
# 随机欠采样获取数据
# 首先需要确定特征值\标签值

y = data["target"]
x = data.drop(["id", "target"], axis=1)
x.head()
y.head()
# 欠采样获取数据
from imblearn.under_sampling import RandomUnderSampler

rus = RandomUnderSampler(random_state=0)

X_resampled, y_resampled = rus.fit_resample(x, y)

x.shape, y.shape #((61878, 93), (61878,))

X_resampled.shape, y_resampled.shape #((17361, 93), (17361,))

# 图形可视化,查看数据分布
sns.countplot(y_resampled)
plt.show()
y_resampled.head()
from sklearn.preprocessing import LabelEncoder

le = LabelEncoder()
y_resampled = le.fit_transform(y_resampled)

y_resampled #array([0, 0, 0, ..., 8, 8, 8])
分割数据
from sklearn.model_selection import train_test_split

x_train, x_test, y_train, y_test = train_test_split(X_resampled, y_resampled, test_size=0.2)

x_train.shape, y_train.shape #((13888, 93), (13888,))

x_test.shape, y_test.shape #((3473, 93), (3473,))

# 图形可视化
sns.countplot(y_test)
plt.show()
# 通过StratifiedShuffleSplit实现数据分割

from sklearn.model_selection import StratifiedShuffleSplit

sss = StratifiedShuffleSplit(n_splits=1, test_size=0.2, random_state=0)

for train_index, test_index in sss.split(X_resampled.values, y_resampled):
    print(len(train_index)) #13888
    print(len(test_index)) #3473

    x_train = X_resampled.values[train_index]
    x_val = X_resampled.values[test_index]

    y_train = y_resampled[train_index]
    y_val = y_resampled[test_index]

print(x_train.shape, x_val.shape) #(13888, 93) (3473, 93)

# 图形可视化
sns.countplot(y_val)
plt.show()
数据标准化
from sklearn.preprocessing import StandardScaler

scaler = StandardScaler()
scaler.fit(x_train)

x_train_scaled = scaler.transform(x_train)
x_val_scaled = scaler.transform(x_val)
数据PCA降维
x_train_scaled.shape #(13888, 93)


from sklearn.decomposition import PCA

pca = PCA(n_components=0.9)
x_train_pca = pca.fit_transform(x_train_scaled)
x_val_pca = pca.transform(x_val_scaled)

print(x_train_pca.shape, x_val_pca.shape) #(13888, 65) (3473, 65)

# 可视化数据降维信息变化程度
plt.plot(np.cumsum(pca.explained_variance_ratio_))

plt.xlabel("元素数量")
plt.ylabel("表达信息百分占比")

plt.show()
模型训练
基本模型训练
from xgboost import XGBClassifier

xgb = XGBClassifier()
xgb.fit(x_train_pca, y_train)
# 输出预测值,一定输出带有百分占比的预测值
y_pre_proba = xgb.predict_proba(x_val_pca)
y_pre_proba
# logloss评估
from sklearn.metrics import log_loss

log_loss(y_val, y_pre_proba, eps=1e-15, normalize=True) #0.7845457684689274
xgb.get_params
模型调优
确定最优的estimators
scores_ne = []
n_estimators = [100, 200, 300, 400, 500, 550, 600, 700]

for nes in n_estimators:
    print("n_estimators:", nes)
    xgb = XGBClassifier(max_depth=3,
                        learning_rate=0.1,
                        n_estimators=nes,
                        objective="multi:softprob",
                        n_jobs=-1,
                        nthread=4,
                        min_child_weight=1,
                        subsample=1,
                        colsample_bytree=1,
                        seed=42)

    xgb.fit(x_train_pca, y_train)
    y_pre = xgb.predict_proba(x_val_pca)
    score = log_loss(y_val, y_pre)
    scores_ne.append(score)

    print("每次测试的logloss值是:{}".format(score))
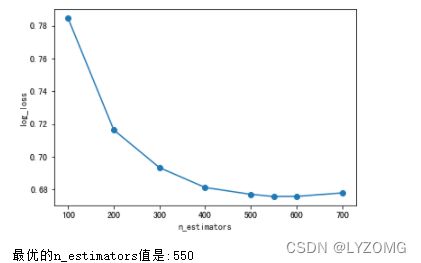
# 图形化展示相应的logloss值
plt.plot(n_estimators, scores_ne, "o-")

plt.xlabel("n_estimators")
plt.ylabel("log_loss")
plt.show()

print("最优的n_estimators值是:{}".format(n_estimators[np.argmin(scores_ne)]))
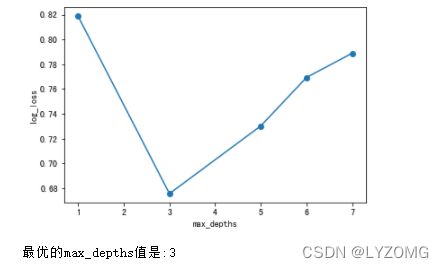
确定最优的max_depth
scores_md = []
max_depths = [1,3,5,6,7]

for md in max_depths:
    print("max_depth:", md)
    xgb = XGBClassifier(max_depth=md,
                        learning_rate=0.1,
                        n_estimators=n_estimators[np.argmin(scores_ne)],
                        objective="multi:softprob",
                        n_jobs=-1,
                        nthread=4,
                        min_child_weight=1,
                        subsample=1,
                        colsample_bytree=1,
                        seed=42)

    xgb.fit(x_train_pca, y_train)
    y_pre = xgb.predict_proba(x_val_pca)
    score = log_loss(y_val, y_pre)
    scores_md.append(score)

    print("每次测试的logloss值是:{}".format(score))
# 图形化展示相应的logloss值
plt.plot(max_depths, scores_md, "o-")

plt.xlabel("max_depths")
plt.ylabel("log_loss")
plt.show()

print("最优的max_depths值是:{}".format(max_depths[np.argmin(scores_md)]))
**依据上面模式,运行调试下面参数
min_child_weights,
subsamples,
consample_bytrees,
etas**
xgb = XGBClassifier(learning_rate =0.1,
                    n_estimators=550,
                    max_depth=3,
                    min_child_weight=3,
                    subsample=0.7,
                    colsample_bytree=0.7,
                    nthread=4,
                    seed=42,
                    objective='multi:softprob')

xgb.fit(x_train_scaled, y_train)

y_pre = xgb.predict_proba(x_val_scaled)

print("测试数据的log_loss值为 : {}".format(log_loss(y_val, y_pre, eps=1e-15, normalize=True)))
测试数据的log_loss值为 : 0.5944022517380477


