逻辑回归【机器学习笔记简摘】
简单来说, 逻辑回归(Logistic Regression)是一种用于解决二分类(0 or 1)问题的机器学习方法,用于估计某种事物的可能性。
那么逻辑回归与线性回归是什么关系呢?
逻辑回归(Logistic Regression)与线性回归(Linear Regression)都是一种广义线性模型(generalized linear model)。逻辑回归假设因变量 y 服从伯努利分布,而线性回归假设因变量 y 服从高斯分布。 因此与线性回归有很多相同之处,去除Sigmoid映射函数的话,逻辑回归算法就是一个线性回归。可以说,逻辑回归是以线性回归为理论支持的,但是逻辑回归通过Sigmoid函数引入了非线性因素,因此可以轻松处理0/1分类问题。
无论机器器学习领域如何折腾,逻辑回归依然是一个受工业商业热爱,使用广泛的模型,因为它有着不可替代的优点:
1.逻辑回归对线性关系的拟合效果好到丧心病狂,特征与标签之间的线性关系极强的数据,比如金融领域中的信用卡欺诈,评分卡制作,电商中的营销预测等相关的数据,都是逻辑回归的强项。虽然现在有了梯度提升树GDBT,比逻辑回归效果更好,也被许多数据咨询公司启用,但逻辑回归在金融领域,尤其是银行业中的统治地位依然不可动摇(相对的,逻辑回归在非线性数据的效果很多时候比瞎猜还不如,所以如果已经知道数据之间的联系是非线性的,千万不要迷信逻辑回归)
2.逻辑回归计算快:对于线性数据,(大部分时候)逻辑回归的拟合和计算都非常快,计算效率优于SVM和随机森林,亲测表示在大型数据上尤其能够看出区别
3.逻辑回归返回的分类结果不是固定的0,1,而是以小数形式呈现的类概率数字:因此可以把逻辑回归返回的结果当成连续型数据来利用。比如在评分卡制作时,不仅需要判断客户是否会违约,还需要给出确定的”信用分“,而这个信用分的计算就需要使用类概率计算出的对数几率,而决策树和随机森林这样的分类器,可以产出分类结果,却无法帮助我们计算分数(当然,在sklearn中,决策树也可以产生概率,使用接口predict_proba调用就好,但一般来说,正常的决策树没有这个功能)。
另外,逻辑回归还有抗噪能力强的优点。福布斯杂志在讨论逻辑回归的优点时,甚至有着“技术上来说,最佳模型的AUC面积低于0.8时,逻辑回归非常明显优于树模型”的说法。并且,逻辑回归在小数据集上表现更好,在大型的数据集上,树模型有着更好的表现。
由此,逻辑回归的本质是一个返回对数几率的,在线性数据上表现优异的分类器,它主要被应用在金融领域。其数学目的是求解能够让模型对数据拟合程度最高的参数的值,以此构建预测函数,然后将特征矩阵输入预测函数来计算出逻辑回归的结果y。注意,虽然我们熟悉的逻辑回归通常被用于处理理二分类问题,但逻辑回归也可以做多分类。
要想掌握逻辑回归,必须掌握两点:
1、逻辑回归中,其输入值是什么
2、如何判断逻辑回归的输出

逻辑回归的输入就是一个线性回归的结果。
激活函数
sigmoid函数
| Sigmoid函数的公式和性质 |
|---|
| Sigmoid函数是一个S型的函数,当自变量z趋近正无穷时,因变量g(z)趋近于1,而当z趋近负无穷时,g(z)趋近于0,它能够将任何实数映射到(0,1)区间,使其可用于将任意值函数转换为更适合二分类的函数。 因为这个性质,Sigmoid函数也被当作是归一化的一种方法,与MinMaxSclaer同理,是属于数据预处理中的“缩放”功能,可以将数据压缩到[0,1]之内。区别在于,MinMaxScaler归一化之后,是可以取到0和1的(最大值归一化后就是1,最小值归一化后就是0),但Sigmoid函数只是无限趋近于0和1。 |
g ( θ T x ) = 1 1 + e − θ T x g(\theta^Tx)=\frac{1}{1+e^{-\theta ^Tx}} g(θTx)=1+e−θTx1
判断标准
- 回归的结果输入到sigmoid函数当中
- 输出结果:[0, 1]区间中的一个概率值,默认为0.5为阈值
逻辑回归最终的分类是通过属于某个类别的概率值来判断是否属于某个类别,并且这个类别默认标记为1(正例),另外的一个类别会标记为0(反例)。(方便损失计算)
输出结果解释(重要):假设有两个类别A,B,并且假设我们的概率值为属于A(1)这个类别的概率值。现在有一个样本的输入到逻辑回归输出结果0.6,那么这个概率值超过0.5,意味着我们训练或者预测的结果就是A(1)类别。那么反之,如果得出结果为0.3那么,训练或者预测结果就为B(0)类别。
所以接下来我们回忆之前的线性回归预测结果我们用均方误差衡量,那如果对于逻辑回归,我们预测的结果不对该怎么去衡量这个损失呢?我们来看这样一张图

损失以及优化
逻辑回归的损失,称之为对数似然损失,公式如下:
分开类别:

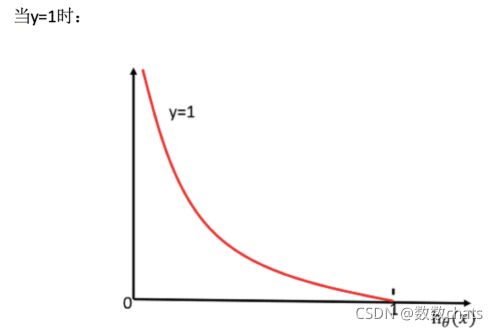
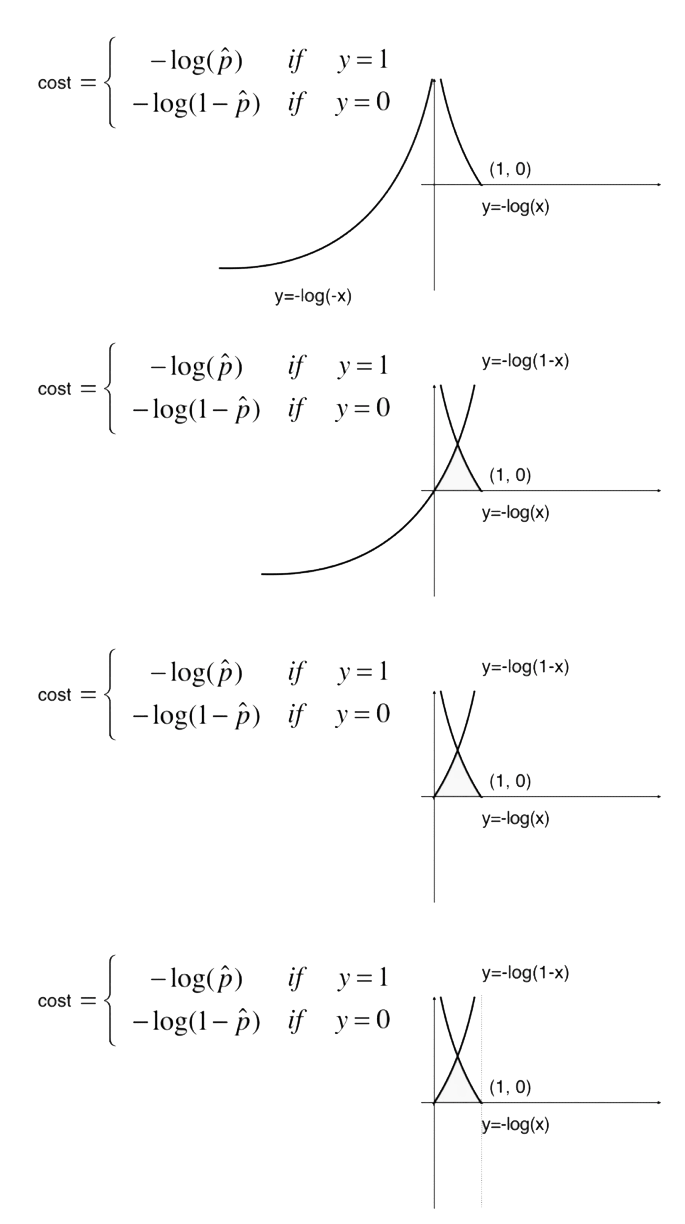
怎么理解单个的式子呢?这个要根据log的函数图像来理解
综合完整损失函数

接下来我们呢就带入上面那个例子来计算一遍,就能理解意义了。

我们已经知道,log( P), P值越大,结果越小,所以我们可以对着这个损失的式子去分析
优化
同样使用梯度下降优化算法,去减少损失函数的值。这样去更新逻辑回归前面对应算法的权重参数,提升原本属于1类别的概率,降低原本是0类别的概率。
逻辑回归api
| 逻辑回归相关的类 | 说明 |
|---|---|
| linear_model.LogisticRegression | 逻辑回归分类器(又叫logit回归,最大嫡分类器) |
| linear_model.LogisticRegressionCV | 带交叉验证的逻辑回归分类器 |
| linear_model.logistic_regression_path | 计算Logistic回归模型以获得正则化参数的列表 |
| linear_model.SGDClassifier | 利用梯度下降求解的线性分类器(SVM,逻辑回归等等) |
| linear_model.SGDRegressor | 利用梯度下降最小化正则化后的损失函数的线性回归模型 |
| metrics.log_loss | 对数损失,又称逻辑损失或交叉熵损失 |
| 其他会涉及的类 | 说明 |
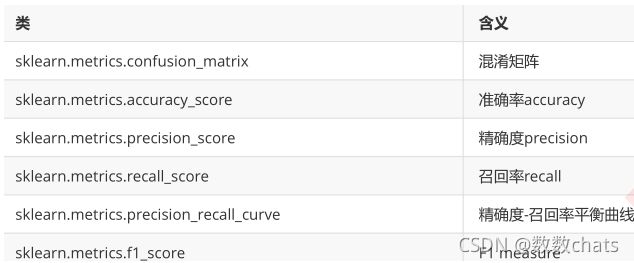
| metrics.confusion_matrix | 混淆矩阵,模型评估指标之一 |
| metrics.roc_auc_score | ROC曲线,模型评估指标之一 |
| metrics.accuracy_score | 精确性,模型评估指标之一 |
class sklearn.linear_model.LogisticRegression(penalty='l2', *, dual=False, tol=0.0001, C=1.0, fit_intercept=True, intercept_scaling=1, class_weight=None, random_state=None, solver='lbfgs', max_iter=100, multi_class='auto', verbose=0, warm_start=False, n_jobs=None, l1_ratio=None)
-
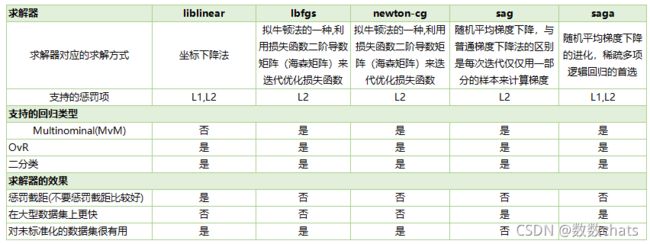
solver可选参数:{‘liblinear’, ‘sag’, ‘saga’,‘newton-cg’, ‘lbfgs’},。
- 对于小数据集来说,“liblinear”是个不错的选择,而“sag”和’saga’对于大型数据集会更快。
- 对于多类问题,只有’newton-cg’, ‘sag’, 'saga’和’lbfgs’可以处理多项损失;“liblinear”仅限于“one-versus-rest”分类。
- liblinear’:使用坐标轴下降法来迭代优化损失函数。‘lbfgs’:拟牛顿法的一种。利用损失函数二阶导数矩阵即海森矩阵来迭代优化损失函数,推荐用于较小的数据集。‘newton-cg’:牛顿法的一种。‘sag’:随机平均梯度下降。每次迭代仅仅用一部分的样本来计算梯度,适合于样本数据多的时候。saga 是 sag 的一类变体,它支持非平滑(non-smooth)的 L1 正则选项 penalty=“l1” 。因此对于稀疏多项式 logistic 回归 ,往往选用该求解器。
-
multi_class=‘auto’:
- ‘ovr’ or ‘multinomial’。一对多和多对多。如果选择的选项是’ovr’,那么在每个类上训练一个二分类问题。 对于“多项式”,最小化的损失是整个概率分布中的多项式损失拟合,即使数据是二分类的。 当solver ='liblinear’时,‘multinomial’不可用。 如果数据是二分类的,或者如果solver =‘liblinear’,‘auto’选择’ovr’,否则选择’multinomial’
-
penalty:正则化的种类
可以输入"l1"或"l2"来指定使用哪一种正则化方式,不填写默认"l2"。
注意,若选择"l1"正则化,参数solver仅能够使用”liblinear",若使用“l2”正则化,参数solver中
所有的求解方式都可以使用 -
C:正则化力度。是正则化强度的逆
C正则化强度的倒数,必须是一个大于0的浮点数,不填写默认1.0,即默认一倍正则项
C越小,对损失函数的惩罚越重,正则化的效力越强
方法:
(1)decision_function(self, X),预测样本置信度分数,样本的置信度得分是该样本与超平面的有符号距离。Parameters:X:类似数组的或稀疏矩阵的样本集,shape(n_samples,n_features)。Returns:array, 若为2分类,shape=(n_samples,) 否则shape= (n_samples, n_classes)。得到每个(sample, class) 样本,类标的置信度分数。在二分类中,self.classes[1]>0表示该类要被预测了。
(2)densify(self):将系数矩阵转换为numpy.ndarray。这是coef的默认格式,并且是训练所必需的,因此只有在先前已经过稀疏化的模型上才需要调用此方法; 否则,这是一个无操作。Returns:
self : estimator。
(3)fit(self, X, y, sample_weight=None):使用给定的训练数据训练模型。Parameters:X : {array-like, sparse matrix}, shape (n_samples, n_features),它是个训练向量。y : array-like, shape (n_samples,)与X相关联的目标向量。sample_weight : array-like, shape (n_samples,) optional,分配给各个样本的权重数组。 如果没有提供,则每个样品给定单位权重。Returns:类对象。
(4)get_params(self, deep=True):获取估计的参数。Parameters:deep : boolean, optional,如果为True,将返回此估计器的参数并包含作为估算器的子对象。Returns:params:将字符串映射到any,就是映射到其值的参数名称。
(5)predict(self, X):预测X中样本的类标。Parameters:X : array_like or sparse matrix, shape (n_samples, n_features),就是样本。Returns:C : array, shape [n_samples],是每个样本的预测列表构成的。
(6)predict_log_proba(self, X):概率的log形式。所有类的返回估计值按类标签排序。Parameters:X : array-like, shape = [n_samples, n_features],Returns:T : array-like, shape = [n_samples, n_classes], 返回模型中每个类的样本的对数概率,其中类按self.classes中的顺序排序。
(7)predict_proba(self, X):类概率估计。所有类的返回估计值按类标签排序。对于multi_class多分类问题,如果multi_class设置为“multincial”,则softmax函数用于查找对每个类的预测概率。 否则使用一对其余的方法,即使用逻辑函数计算每个类假设为正的概率。 并在所有类中规范化这些值。Parameters:X : array-like, shape = [n_samples, n_features], Returns:T : array-like, shape = [n_samples, n_classes],返回模型中样本对每个类的概率,其中类按照它们的顺序排序self.classes.。
(8)score(self, X, y, sample_weight=None):返回给定测试数据和标签的平均准确度mean accuracy。在多标签分类中,这是一个哈希度量的子集准确度,因为需要为每个样本正确预测每个标签集。X : array-like, shape = (n_samples, n_features)测试样本集,y : array-like, shape = (n_samples) or (n_samples, n_outputs)对应的标签。sample_weight : array-like, shape = [n_samples],optional, 样本权重。Returns:score : float,Mean accuracy of self.predict(X) wrt. y.
(9)set_params(self, params):为某估算器设置删除。
(10)sparsify(self):将系数矩阵转换为稀疏格式。将coef成员转换为scipy.sparse矩阵,对于L1正则化模型,它可以比通常的numpy.ndarray有更高的内存和存储效率。intercept成员不会被转换。
注意:对于非稀疏模型,即当coef中没有多个零时,这实际上可能会增加内存使用量,因此请谨慎使用此方法。 根据经验,可以使用(coef == 0).sum()计算的零元素数量必须超过50%才能提供显着的优势。调用此方法后,在调用densify之前,进一步使用partial_fit方法(如果有)将无效。
默认将类别数量少的当做正例
LogisticRegression方法相当于 SGDClassifier(loss=“log”, penalty=" "),SGDClassifier实现了一个普通的随机梯度下降学习。而使用LogisticRegression(实现了SAG)
案例:癌症分类预测-良/恶性乳腺癌肿瘤预测
原始数据的下载地址:https://archive.ics.uci.edu/ml/machine-learning-databases/
import pandas as pd
import numpy as np
from sklearn.model_selection import train_test_split
from sklearn.preprocessing import StandardScaler
from sklearn.linear_model import LogisticRegression
from sklearn.metrics import classification_report


# 1.获取数据

names = ['Sample code number', 'Clump Thickness', 'Uniformity of Cell Size', 'Uniformity of Cell Shape',
                   'Marginal Adhesion', 'Single Epithelial Cell Size', 'Bare Nuclei', 'Bland Chromatin',
                   'Normal Nucleoli', 'Mitoses', 'Class']

data = pd.read_csv("https://archive.ics.uci.edu/ml/machine-learning-databases/breast-cancer-wisconsin/breast-cancer-wisconsin.data",
                  names=names)
data.head()
# 2.基本数据处理
# 2.1 缺失值处理
data = data.replace(to_replace="?", value=np.NaN)
data = data.dropna()
# 2.2 确定特征值,目标值
x = data.iloc[:, 1:10]
x.head()

y = data["Class"]
y.head()

# 2.3 分割数据
x_train, x_test, y_train, y_test = train_test_split(x, y, random_state=22)

# 3.特征工程(标准化)
transfer = StandardScaler()
x_train = transfer.fit_transform(x_train)
x_test = transfer.transform(x_test)

# 4.机器学习(逻辑回归)
estimator = LogisticRegression()
estimator.fit(x_train, y_train)
分类评估方法
1.混淆矩阵
    真正例(TP)
    伪反例(FN)
    伪正例(FP)
    真反例(TN)
2. 精确率(Precision)与召回率(Recall)
    准确率:(对不对)
        (TP+TN)/(TP+TN+FN+FP)
    精确率 -- 查的准不准
        TP/(TP+FP)
    召回率 -- 查的全不全
        TP/(TP+FN)
    F1-score
        反映模型的稳健性
3.api
    sklearn.metrics.classification_report(y_true, y_pred)
精确率与召回率
- 精确率:预测结果为正例样本中真实为正例的比例 p r e c i s i o n = T P T P + F P precision=\frac{TP}{TP+FP} precision=TP+FPTP
- 召回率:真实为正例的样本中预测结果为正例的比例(查得全,对正样本的区分能力) r e c a l l = T P T P + F N recall=\frac{TP}{TP+FN} recall=TP+FNTP
- F1-score:反映了模型的稳健型

1)基础理论 - 调整阈值的大小,可以调节精准率和召回率的比重;
- 阈值:threshold,分类边界值,score > threshold 时分类为 1,score < threshold 时分类为 0;
- 阈值增大,精准率提高,召回率降低;阈值减小,精准率降低,召回率提高;
- 精准率和召回率是相互牵制,互相矛盾的两个变量,不能同时增高;
- 逻辑回归的决策边界不一定非是 θ T ⋅ x b = 0 \theta^{T} \cdot x_b=0 θT⋅xb=0,也可以是任意的值,可根据业务而定: θ T ⋅ x b = t h r e s h o l d \theta^{T} \cdot x_b=threshold θT⋅xb=threshold,大于 threshold 时分类为 1,小于 threshold 时分类为 0;
- 推广到其它算法,先计算出一个分数值 score ,再与 threshold 比较做分类判定;
2)举例说明精准率和召回率相互制约的关系(一)
- 精准率:4 / 5 = 0.80;
- 召回率:4 / 6 = 0.67;
- 精准率:2 / 2 = 1.00;
- 召回率:2 / 6 = 0.33;
- 精准率:6 / 8 = 0.75;
- 召回率:6 / 6 = 1.00;
3)举例说明精准率和召回率相互制约的关系(二)
-
LogisticRegression() 类中的 predict() 方法中,默认阈值 threshold 为 0,再根据 decision_function() 方法计算的待预测样本的 score 值进行对比分类:score < 0 分类结果为 0,score > 0 分类结果为 1;
-
.decision_function(X_test):计算所有待预测样本的 score 值,以向量的数量类型返回结果;
此处的 score 值不是概率值,是另一种判断分类的方式中样本的得分,根据样本的得分对样本进行分类;
例子
import numpy as np
from sklearn import datasets
from sklearn.model_selection import train_test_split
from sklearn.linear_model import LogisticRegression

digits = datasets.load_digits()
X = digits.data
y = digits.target.copy()
y[digits.target==9] = 1
y[digits.target!=9] = 0

X_train, X_test, y_train, y_test = train_test_split(X, y, random_state=666)

log_reg = LogisticRegression()
log_reg.fit(X_train, y_train)
阈值 threshold = 0
y_predict_1 = log_reg.predict(X_test)

from sklearn.metrics import confusion_matrix
confusion_matrix(y_test, y_predict_1)
# 混淆矩阵:array([[403, 2],
#                 [9, 36]], dtype=int64)

from sklearn.metrics import precision_score
print('precision_score',precision_score(y_test, y_predict_1))
# 精准率:0.9473684210526315

from sklearn.metrics import recall_score
print('recall_score',recall_score(y_test, y_predict_1))
# 召回率:0.8
阈值 threshold = 5
decision_score = log_reg.decision_function(X_test)

# 更改 decision_score ,经过向量变化得到新的预测结果 y_predict_2;
# decision_score > 5,增大阈值为 5;(也就是提高判断标准)
y_predict_2 = np.array(decision_score >= 5, dtype='int')

confusion_matrix(y_test, y_predict_2)
# 混淆矩阵:array([[404,   1],
#                 [ 21,  24]], dtype=int64)

print('precision_score',precision_score(y_test, y_predict_2))
# 精准率:0.96

print('recall_score',recall_score(y_test, y_predict_2))
# 召回率:0.5333333333333333
更改阈值的思路:基于 decision_function() 方法,改变 score 值,重新设定阈值,不再经过 predict() 方法,而是经过向量变化得到新的分类结果;
阈值 threshold = -5
decision_score = log_reg.decision_function(X_test)
y_predict_3 = np.array(decision_score >= -5, dtype='int')

confusion_matrix(y_test, y_predict_3)
# 混淆矩阵:array([[390,  15],
#                 [5,  40]], dtype=int64)

print('precision_score',precision_score(y_test, y_predict_3))
# 精准率:0.7272727272727273

print('recall_score',recall_score(y_test, y_predict_3))
# 召回率:0.8888888888888888
- 分析:
- 精准率和召回率相互牵制,相互平衡的,一个升高,另一个就会降低;
- 阈值越大,精准率越高,召回率越低;阈值越小,精准率越低,召回率越高;
- 更改阈值:1)通过 LogisticRegression() 模块下的 decision_function() 方法得到预测得分;2)不使用 predict() 方法,而是重新设定阈值,通过向量转化,直接根据预测得分进行样本分类;
分类评估报告api
sklearn.metrics.classification_report(y_true, y_pred, *, labels=None, target_names=None, sample_weight=None, digits=2, output_dict=False, zero_division='warn')
-
- y_true:真实目标值
- y_pred:估计器预测目标值
- labels:指定类别对应的数字
- target_names:目标类别名称
- return:每个类别精确率与召回率
from sklearn.metrics import classification_report
y_true = [0, 1, 2, 2, 2]
y_pred = [0, 0, 2, 2, 1]
target_names = ['class 0', 'class 1', 'class 2']
print(classification_report(y_true, y_pred, target_names=target_names))

y_pred = [1, 1, 0]
y_true = [1, 1, 1]
print(classification_report(y_true, y_pred, labels=[1, 2, 3]))

假设这样一个情况,如果99个样本癌症,1个样本非癌症,不管怎样我全都预测正例(默认癌症为正例),准确率就为99%但是这样效果并不好,这就是样本不均衡下的评估问题
问题:如何衡量样本不均衡下的评估?
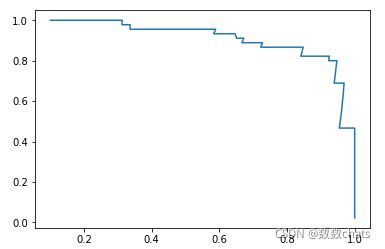
精准率 - 召回率曲线(P - R 曲线)
-
对应分类算法,都可以调用其 decision_function() 方法,得到算法对每一个样本的决策的分数值;
-
LogisticRegression() 算法中,默认的决策边界阈值为 0,样本的分数值大于 0,该样本分类为 1;样本的分数值小于 0,该样本分类为 0。
-
思路:随着阈值 threshold 的变化,精准率和召回率跟着相应变化;
-
设置不同的 threshold 值:
decision_scores = log_reg.decision_function(X_test)
thresholds = np.arange(np.min(decision_scores), np.max(decision_scores), 0.1)
0.1 是区间取值的步长;
1)编码实现 threshold - Precision、Recall 曲线和 P - R曲线
import numpy as np
import matplotlib.pyplot as plt
from sklearn import datasets
from sklearn.model_selection import train_test_split
from sklearn.linear_model import LogisticRegression
from sklearn.metrics import precision_score
from sklearn.metrics import recall_score

digits = datasets.load_digits()
X = digits.data
y = digits.target.copy()
y[digits.target==9] = 1
y[digits.target!=9] = 0

X_train, X_test, y_train, y_test = train_test_split(X, y, random_state=666)

log_reg = LogisticRegression()
log_reg.fit(X_train, y_train)
decision_scores = log_reg.decision_function(X_test)

precisions = []
recalls = []
thresholds = np.arange(np.min(decision_scores), np.max(decision_scores), 0.1)

for threshold in thresholds:
    y_predict = np.array(decision_scores >= threshold, dtype='int')
    precisions.append(precision_score(y_test, y_predict))
    recalls.append(recall_score(y_test, y_predict))
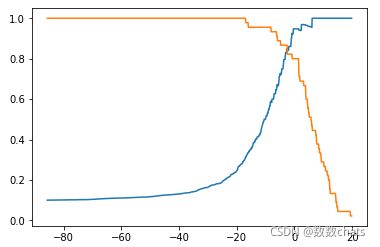
threshold - Precision、Recall 曲线
plt.plot(thresholds, precisions)
plt.plot(thresholds, recalls)
plt.show()
plt.plot(precisions, recalls)
plt.show()
2)scikit-learn 中 precision_recall_curve() 方法
根据 y_test、y_predicts 直接求解 precisions、recalls、thresholds;
from sklearn.metrics import precision_recall_curve
digits = datasets.load_digits()
X = digits.data
y = digits.target.copy()
y[digits.target==9] = 1
y[digits.target!=9] = 0

X_train, X_test, y_train, y_test = train_test_split(X, y, random_state=666)

log_reg = LogisticRegression()
log_reg.fit(X_train, y_train)
decision_scores = log_reg.decision_function(X_test)

precisions, recalls, thresholds = precision_recall_curve(y_test, decision_scores)

precisions.shape
# (145,)

recalls.shape
# (145,)

thresholds.shape
# (144,)
- 现象:thresholds 中的元素个数,比 precisions 和recalls 中的元素个数少 1 个;
- 原因:当 precision = 1、recall = 0 时,不存在 threshold;
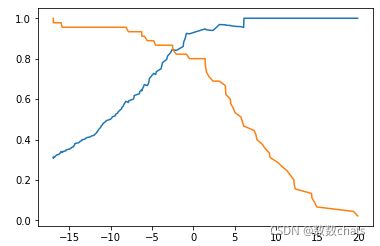
threshold - Precision、Recall 曲线
plt.plot(thresholds, precisions[:-1])
plt.plot(thresholds, recalls[:-1])
plt.show()
plt.plot(precisions, recalls)
plt.show()
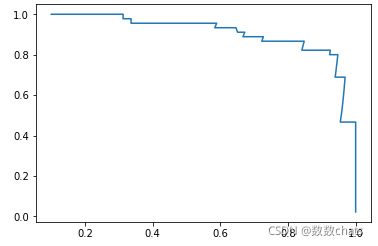
途中曲线开始急剧下降的点,可能就是精准率和召回率平衡位置的点;
3)分析
不同的模型对应的不同的 Precision - Recall 曲线:

1、外层曲线对应的模型更优;或者称与坐标轴一起包围的面积越大者越优。
2、P - R 曲线也可以作为选择算法、模型、超参数的指标;但一般不适用此曲线,而是使用 ROC 曲线。
roc曲线和auc指标
    roc曲线
        通过TPR和FPR来进行图形绘制,然后绘制之后,形成一个指标auc
    auc
        越接近1,效果越好
        越接近0,效果越差
        越接近0.5,效果就是胡说
    注意:
        这个指标主要用于评价不平衡的二分类问题
   api
    sklearn.metrics.roc_auc_score(y_true, y_score)
        y_true -- 要把正例转换为1,反例转换为0

ROC曲线的绘制
    1.构建模型,把模型的概率值从大到小进行排序
    2.从概率最大的点开始取值,一直进行TPR和FPR的计算,然后构建整体模型,得到结果
    3.其实就是在求解积分(面积)
TPR与FPR
-
TPR = TP / (TP + FN)
- 所有真实类别为1的样本中,预测类别为1的比例
-
FPR = FP / (FP + TN)
- 所有真实类别为0的样本中,预测类别为1的比例
-
ROC曲线的横轴就是FPRate,纵轴就是TPRate,当二者相等时,表示的意义则是:对于不论真实类别是1还是0的样本,分类器预测为1的概率是相等的,此时AUC为0.5
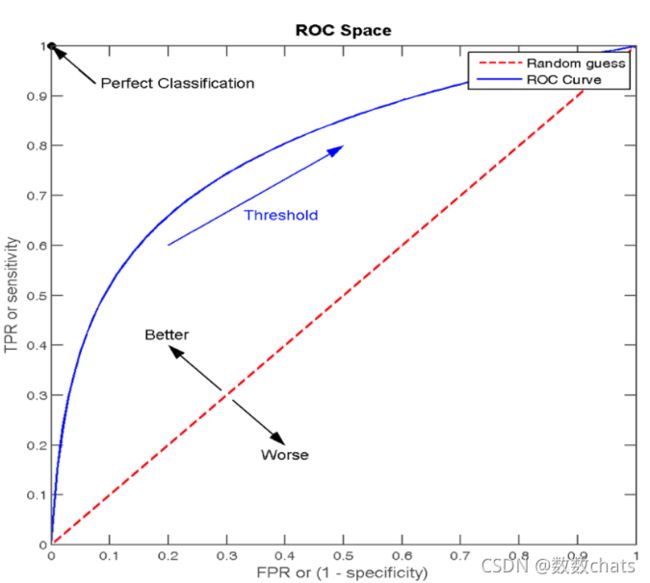
AUC指标 -
AUC的概率意义是随机取一对正负样本,正样本得分大于负样本的概率
-
AUC的最小值为0.5,最大值为1,取值越高越好
-
AUC=1,完美分类器,采用这个预测模型时,不管设定什么阈值都能得出完美预测。绝大多数预测的场合,不存在完美分类器。
-
0.5
最终AUC的范围在[0.5, 1]之间,并且越接近1越好
AUC计算API
from sklearn.metrics import roc_auc_score
sklearn.metrics.roc_auc_score(y_true, y_score, *, average='macro', sample_weight=None, max_fpr=None, multi_class='raise', labels=None)
- 计算ROC曲线面积,即AUC值
- y_true:每个样本的真实类别,必须为0(反例),1(正例)标记
- y_score:预测得分,可以是正类的估计概率、置信值或者分类器方法的返回值
import numpy as np
from sklearn import metrics
y = np.array([1, 1, 2, 2])
scores = np.array([0.1, 0.4, 0.35, 0.8])
fpr, tpr, thresholds = metrics.roc_curve(y, scores, pos_label=2)
fpr
# array([ 0. ,  0.5,  0.5,  1. ])

tpr
# array([ 0.5,  0.5,  1. ,  1. ])

thresholds
# array([1.8 , 0.8 , 0.4 , 0.35, 0.1 ])
上述是基础实现,可以按点画图
thresholds为阈值,以FP为X轴,TP为Y轴,画ROC曲线如下图所示:
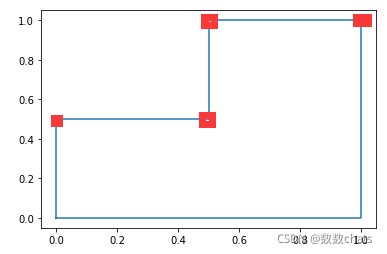
由上图围成的面积等于:0.75
调用roc_auc_score
import numpy as np
from sklearn.metrics import roc_auc_score
y_true = np.array([0, 0, 1, 1])
y_scores = np.array([0.1, 0.4, 0.35, 0.8])
roc_auc_score(y_true, y_scores)
#0.75
与 P - R 曲线的区别
-
P - R 曲线:应用于判定由极度有偏数据所训练的模型的优劣;
-
ROC 曲线:应用于比较两个模型的优劣;
模型:可以是同样算法不同超参数所得的不同模型,也可以是不同算法所得的不同模型;
数据集的决策边界
(限线性回归、逻辑回归)
-
二维特征空间中,决策边界是一条理论上直线,该直线是有线性模型的系数和截距决定的,并不一定有样本满足此条件;
-
如果样本只有两个特征,决策边界可以表示为:
-
θT.xb = θ0 + θ1.x1 + θ2.x2 = 0,则该边界是一条直线,因为分类问题中特征空间的坐标轴都表示特征;
则有: x 2 = θ 0 − θ 1 x 1 θ 2 x_2=\frac{\theta_0-\theta_1x_1}{\theta_2} x2=θ2θ0−θ1x1
1)在二维特征空间中绘制决策边界
import numpy as np
import matplotlib.pyplot as plt
from sklearn import datasets
from sklearn.model_selection import train_test_split
from sklearn.linear_model import LogisticRegression


iris = datasets.load_iris()

X = iris.data
y = iris.target
X = X[y<2, :2]
y = y[y<2]

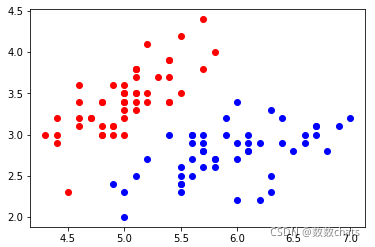
plt.scatter(X[y==0, 0], X[y==0, 1], color='red')
plt.scatter(X[y==1, 0], X[y==1, 1], color='blue')
plt.show()
x_train, y_test, y_train, y_test = train_test_split(X, y, random_state=666)

log_reg = LogisticRegression()
log_reg.fit(x_train, y_train)

# x2()函数:求满足决策边界关系的直线的函数值;
def x2(x1):
    return (-log_reg.coef_[0][0] * x1 - log_reg.intercept_) / log_reg.coef_[0][1]


x1_plot = np.linspace(4, 8, 100).reshape(-1, 1)
x2_plot = x2(x1_plot)

plt.scatter(X[y==0, 0], X[y==0, 1], color='red')
plt.scatter(X[y==1, 0], X[y==1, 1], color='blue')
plt.plot(x1_plot, x2_plot)
plt.axis([4, 8, 2, 4.5])
plt.show()
-
思路:特征空间中分布着无数的点,通过细分,将特征空间分割无数的点,对于每一个点都使用模型对其进行预测分类,将这些预测结果绘制出来,不同颜色的点的边界就是分类的决策边界;
-
分割方法:将特征空间的坐标轴等分为 n 份(可视化时只显示两种特征),则特征空间被分割为 n X n 个点(每个点相当于一个样本),用模型预测这 n2 个点的类型,经预测结果(样本点)显示在特征空间;
# plot_decision_boundary()函数:绘制模型在二维特征空间的决策边界;
def plot_decision_boundary(model, axis):
    # model:算法模型;
    # axis:区域坐标轴的范围,其中 0,1,2,3 分别对应 x 轴和 y 轴的范围;

    # 1)将坐标轴等分为无数的小点,将 x、y 轴分别等分 (坐标轴范围最大值 - 坐标轴范围最小值)*100 份,
    # np.meshgrid():
    x0, x1 = np.meshgrid(
        np.linspace(axis[0], axis[1], int((axis[1]-axis[0])*100)).reshape(-1,1),
        np.linspace(axis[2], axis[3], int((axis[3]-axis[2])*100)).reshape(-1,1)
    )
    # np.c_():
    X_new = np.c_[x0.ravel(), x1.ravel()]

    # 2)model.predict(X_new):将分割出的所有的点,都使用模型预测
    y_predict = model.predict(X_new)
    zz = y_predict.reshape(x0.shape)

    # 3)绘制预测结果
    from matplotlib.colors import ListedColormap
    custom_cmap = ListedColormap(['#EF9A9A','#FFF59D','#90CAF9'])

    plt.contourf(x0, x1, zz, linewidth=5, cmap=custom_cmap)
plot_decision_boundary(log_reg, axis=[4, 7.5, 1.5, 4.5])
plt.scatter(X[y==0, 0], X[y==0, 1], color='red')
plt.scatter(X[y==1, 0], X[y==1, 1], color='blue')
plt.show()

两种色块就是将特征空间分割成 n2 个样本点的分类结果;两种色块的分界线就是该模型的决策边界
2)绘制 kNN 算法的模型的决策边界( 2 种样本)
from sklearn.neighbors import KNeighborsClassifier

knn_clf = KNeighborsClassifier()
knn_clf.fit(x_train, y_train)

plot_decision_boundary(knn_clf, axis=[4, 7.5, 1.5, 4.5])
plt.scatter(X[y==0, 0], X[y==0, 1])
plt.scatter(X[y==1, 0], X[y==1, 1])
plt.show()
knn_clf_all = KNeighborsClassifier()
knn_clf_all.fit(iris.data[:,:2], iris.target)

plot_decision_boundary(knn_clf_all, axis=[4, 8, 1.5, 4.5])
plt.scatter(iris.data[iris.target==0,0], iris.data[iris.target==0,1])
plt.scatter(iris.data[iris.target==1,0], iris.data[iris.target==1,1])
plt.scatter(iris.data[iris.target==2,0], iris.data[iris.target==2,1])
plt.show()
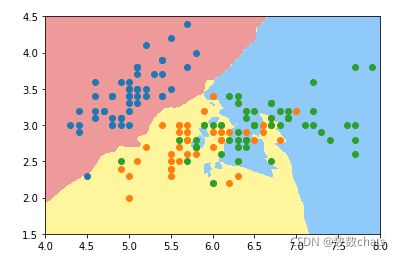
- 问题
- 决策边界不规则,图中黄色区域和蓝色区域的界限不明显;
- 黄色区域存在绿色的点,蓝色区域存在橙色的点;
- 原因:模型可能过拟合;
- 方案:重新调整参数训练模型;
- n_neighbors=5,模型的 k 参数选择了 5,太小,导致模型太复杂;(kNN 算法中,k 值越小模型越复杂)
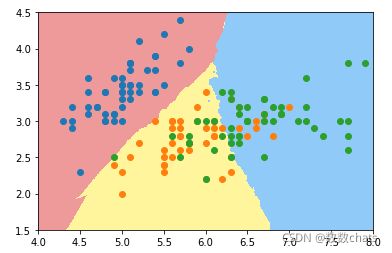
更改 k 参数,重新绘制
knn_clf_all = KNeighborsClassifier(n_neighbors=50)
knn_clf_all.fit(iris.data[:,:2], iris.target)

plot_decision_boundary(knn_clf_all, axis=[4, 8, 1.5, 4.5])
plt.scatter(iris.data[iris.target==0,0], iris.data[iris.target==0,1])
plt.scatter(iris.data[iris.target==1,0], iris.data[iris.target==1,1])
plt.scatter(iris.data[iris.target==2,0], iris.data[iris.target==2,1])
plt.show()
逻辑回归使用多项式特征
-
逻辑回归中的决策边界,本质上相当于在特征平面中找一条直线,用这条直线分割所有的样本对应的分类;
-
逻辑回归只可以解决二分类问题(包含线性和非线性问题),因此其决策边界只可以将特征平面分为两部分;
-
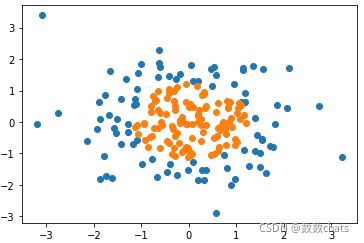
问题:使用直线分类太过简单,因为有很多情况样本的分类的决策边界并不是一条直线,如下图;因为这些样本点的分布是非线性的;
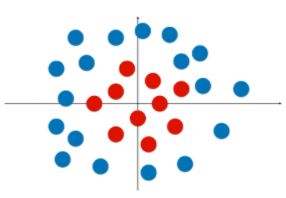
方案:引入多项式项,改变特征,进而更改样本的分布状态;
import numpy as np
import matplotlib.pyplot as plt

np.random.seed(666)
X = np.random.normal(0, 1, size=(200, 2))
y = np.array(X[:,0]**2 + X[:,1]**2 < 1.5, dtype='int')

plt.scatter(X[y==0,0], X[y==0,1])
plt.scatter(X[y==1,0], X[y==1,1])
plt.show()
from sklearn.linear_model import LogisticRegression

log_reg = LogisticRegression()
log_reg.fit(X, y)

def plot_decision_boundary(model, axis):

    x0, x1 = np.meshgrid(
        np.linspace(axis[0], axis[1], int((axis[1]-axis[0])*100)).reshape(-1,1),
        np.linspace(axis[2], axis[3], int((axis[3]-axis[2])*100)).reshape(-1,1)
    )
    X_new = np.c_[x0.ravel(), x1.ravel()]

    y_predict = model.predict(X_new)
    zz = y_predict.reshape(x0.shape)

    from matplotlib.colors import ListedColormap
    custom_cmap = ListedColormap(['#EF9A9A','#FFF59D','#90CAF9'])

    plt.contourf(x0, x1, zz, linewidth=5, cmap=custom_cmap)

plot_decision_boundary(log_reg, axis=[-4, 4, -4, 4])
plt.scatter(X[y==0,0], X[y==0,1])
plt.scatter(X[y==1,0], X[y==1,1])
plt.show()
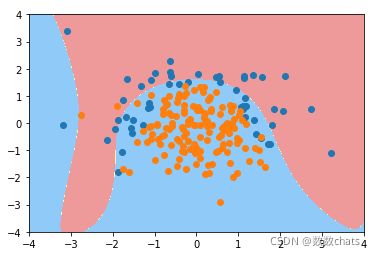
使用逻辑回归算法(添加多项式项)
from sklearn.pipeline import Pipeline
from sklearn.preprocessing import PolynomialFeatures
from sklearn.preprocessing import StandardScaler

def PolynomialLogisticRegression(degree):
    return Pipeline([
        # 管道第一步:给样本特征添加多形式项;
        ('poly', PolynomialFeatures(degree=degree)),
        # 管道第二步:数据归一化处理;
        ('std_scaler', StandardScaler()),
        ('log_reg', LogisticRegression())
    ])

poly_log_reg = PolynomialLogisticRegression(degree=2)
poly_log_reg.fit(X, y)

plot_decision_boundary(poly_log_reg, axis=[-4, 4, -4, 4])
plt.scatter(X[y==0,0], X[y==0,1])
plt.scatter(X[y==1,0], X[y==1,1])
plt.show()
逻辑回归正则化
一、基础理解
-
使用逻辑回归算法训练模型时,为模型引入多项式项,使模型生成不规则的决策边界,对非线性的数据进行分类;
-
问题:引入多项式项后,模型变的复杂,可能产生过拟合现象;
-
方案:对模型正则化处理,损失函数添加正则项(αL2),生成新的损失函数,并对新的损失函数进行优化;
-
优化新的损失函数:
- 满足了让原来的损失函数尽量的小;
- 另一方面,对于 L2 正则项(包含参数 θ 值),限制 θ 的大小;
- 引入了参数 α ,调节新的损失函数中两部分(原损失函数和 L2 正则项)的重要程度;当然也可以引入 αL1 正则项;
二、正则化的其它方式
- 新的表达正则化的方式:只是方式不同,正则化的原来一样;
- 改变了超参数的位置:α、C;
- 如果超参数 C 越大,原损失函数 J(θ) 的地位相对较重要,优化损失函数时主要集中优化 J(θ) ,使其减少到最小;
- 如果超参数 C 非常小,正则项 L2 的地位相对较重要,优化损失函数时主要集中优化 L2 ,使参数 θ 中的元素尽量的小;
- 如果想让使正则项不重要,需要增大参数 C;
-
其实在 J(θ) 前加参数 C,相当于将原来的 αL2 变为 1/αL2 ,两中方式等效;
-
α、C:平衡新的损失函数中两部分的关系;
-
在逻辑回归、SVM算法中,更偏好使用 C.J(θ) + L2 的方式;scikit-learn 的逻辑回归算法中,也是使用此方式;
- 原因:使用 C.J(θ) + L2 方式时,正则项的系数为 1,也就是说优化算法模型时不得不使用正则化;
三、实例scikit-learn中的逻辑回归算法
- scikit-learn中的逻辑回归算法自动封装了模型的正则化的功能,只需要调整 C 和 penalty;
- 主要参数:degree、C、penalty;(还有其它参数)
1)直接使用逻辑回归算法
np.random.seed(666)
X = np.random.normal(0, 1, size=(200, 2))
y = np.array(X[:,0]**2 + X[:,1] < 1.5,dtype='int')

# 随机抽取 20 个样本,让其分类为 1,相当于认为更改数据,添加噪音
for _ in range(20):
    y[np.random.randint(200)] = 1

plt.scatter(X[y==0,0], X[y==0,1])
plt.scatter(X[y==1,0], X[y==1,1])
plt.show()

from sklearn.model_selection import train_test_split

X_train, X_test, y_train, y_test = train_test_split(X, y, random_state=666)

from sklearn.linear_model import LogisticRegression

log_reg = LogisticRegression()
log_reg.fit(X_train, y_train)
# C=1.0:默认超参数 C 的值为1.0;
# penalty='l2':默认使用 L2 正则项;
def plot_decision_boundary(model, axis):

    x0, x1 = np.meshgrid(
        np.linspace(axis[0], axis[1], int((axis[1]-axis[0])*100)).reshape(-1,1),
        np.linspace(axis[2], axis[3], int((axis[3]-axis[2])*100)).reshape(-1,1)
    )
    X_new = np.c_[x0.ravel(), x1.ravel()]

    y_predict = model.predict(X_new)
    zz = y_predict.reshape(x0.shape)

    from matplotlib.colors import ListedColormap
    custom_cmap = ListedColormap(['#EF9A9A','#FFF59D','#90CAF9'])

    plt.contourf(x0, x1, zz, linewidth=5, cmap=custom_cmap)

plot_decision_boundary(log_reg, axis=[-4, 4, -4, 4])
plt.scatter(X[y==0,0], X[y==0,1])
plt.scatter(X[y==1,0], X[y==1,1])
plt.show()
# degree = 2、C 默认1.0

from sklearn.pipeline import Pipeline
from sklearn.preprocessing import PolynomialFeatures
from sklearn.preprocessing import StandardScaler

def PolynomialLogisticRegression(degree):
    return Pipeline([
        ('poly', PolynomialFeatures(degree=degree)),
        ('std_scaler', StandardScaler()),
        ('log_reg', LogisticRegression())
    ])

# 使用管道时,先生成实例的管道对象,在进行 fit;
poly_log_reg = PolynomialLogisticRegression(degree=2)
poly_log_reg.fit(X_train, y_train)

plot_decision_boundary(poly_log_reg, axis=[-4, 4, -4, 4])
plt.scatter(X[y==0,0], X[y==0,1])
plt.scatter(X[y==1,0], X[y==1,1])
plt.show()
# degree = 20、C 默认1.0

poly_log_reg2 = PolynomialLogisticRegression(degree=20)
poly_log_reg2.fit(X_train, y_train)

plot_decision_boundary(poly_log_reg2, axis=[-4, 4, -4, 4])
plt.scatter(X[y==0,0], X[y==0,1])
plt.scatter(X[y==1,0], X[y==1,1])
plt.show()
#degree = 20、C = 0.1

def PolynomialLogisticRegression(degree, C):
    return Pipeline([
        ('poly', PolynomialFeatures(degree=degree)),
        ('std_scaler', StandardScaler()),
        ('log_reg', LogisticRegression(C=C))
    ])

poly_log_reg3 = PolynomialLogisticRegression(degree=20, C=0.1)
poly_log_reg3.fit(X_train, y_train)

plot_decision_boundary(poly_log_reg3, axis=[-4, 4, -4, 4])
plt.scatter(X[y==0,0], X[y==0,1])
plt.scatter(X[y==1,0], X[y==1,1])
plt.show()
# degree = 20、C = 0.1、penalty = 'L1'(penalty:正则项类型, 默认为 L2)

def PolynomialLogisticRegression(degree, C, penalty='l2'):
    return Pipeline([
        ('poly', PolynomialFeatures(degree=degree)),
        ('std_scaler', StandardScaler()),
        ('log_reg', LogisticRegression(C=C, penalty=penalty,solver='liblinear'))
    ])

poly_log_reg4 = PolynomialLogisticRegression(degree=20, C=0.1, penalty='l1')
poly_log_reg4.fit(X_train, y_train)

plot_decision_boundary(poly_log_reg4, axis=[-4, 4, -4, 4])
plt.scatter(X[y==0,0], X[y==0,1])
plt.scatter(X[y==1,0], X[y==1,1])
plt.show()

# solver参数,这个参数定义的是分类器,‘newton-cg’,‘sag’和‘lbfgs’等solvers仅支持‘L2’regularization,‘liblinear’ solver同时支持‘L1’、‘L2’regularization,若dual=Ture,则仅支持L2 penalty。

# 决定惩罚项选择的有2个参数:dual和solver,如果要选L1范数,dual必须是False,solver必须是liblinear
- 分析:degree = 20,模型的决策边界太复杂,模型可能过拟合,使用 L1 正则项进行模型的正则化;
- 分析:模型过拟合后,有很多多项式项,使用 L1 正则项,使得这些多项式项的系数为 0,进而使模型决策边界更加规则,不会弯弯曲曲,便于可视化;

逻辑回归OvR 与 OvO
一、基础理解
- 问题:逻辑回归算法是用回归的方式解决分类的问题,而且只可以解决二分类问题;
- 方案:可以通过改造,使得逻辑回归算法可以解决多分类问题;
- 改造方法:
- OvR(One vs Rest),一对剩余的意思,有时候也称它为 OvA(One vs All);一般使用 OvR,更标准;
- OvO(One vs One),一对一的意思;
- 改造方法不是指针对逻辑回归算法,而是在机器学习领域有通用性,所有二分类的机器学习算法都可使用此方法进行改造,解决多分类问题;
二、原理
1)OvR
- 思想:n 种类型的样本进行分类时,分别取一种样本作为一类,将剩余的所有类型的样本看做另一类,这样就形成了 n 个二分类问题,使用逻辑回归算法对 n 个数据集训练出 n 个模型,将待预测的样本传入这 n 个模型中,所得概率最高的那个模型对应的样本类型即认为是该预测样本的类型**;**

时间复杂度:如果处理一个二分类问题用时 T,此方法需要用时 n.T;
2)OvO
- 思想: n 类样本中,每次挑出 2 种类型,两两结合,一共有 C n 2 C_n^2 Cn2 种二分类情况,使用 C n 2 C_n^2 Cn2 种模型预测样本类型,有 C n 2 C_n^2 Cn2 个预测结果,种类最多的那种样本类型,就认为是该样本最终的预测类型;

- 时间复杂度:如果处理一个二分类问题用时 T,此方法需要用时 C n 2 C_n^2 Cn2 .T = [n.(n - 1) / 2] . T;
3)区别
- OvO 用时较多,其分类结果更准确,因为每一次二分类时都用真实的类型进行比较,没有混淆其它的类别;
1)例(3 种样本类型):LogisticRegression() 默认使用 OvR
import numpy as np
import matplotlib.pyplot as plt
from sklearn import datasets

iris = datasets.load_iris()
# [:, :2]:所有行,0、1 列,不包含 2 列;
X = iris.data[:,:2]
y = iris.target

from sklearn.model_selection import train_test_split
X_train, X_test, y_train, y_test = train_test_split(X, y, random_state=666)

from sklearn.linear_model import LogisticRegression

log_reg = LogisticRegression()
log_reg.fit(X_train, y_train)

log_reg.score(X_test, y_test)
# 准确率:0.7894736842105263
# 绘制决策边界
def plot_decision_boundary(model, axis):

    x0, x1 = np.meshgrid(
        np.linspace(axis[0], axis[1], int((axis[1]-axis[0])*100)).reshape(-1,1),
        np.linspace(axis[2], axis[3], int((axis[3]-axis[2])*100)).reshape(-1,1)
    )
    X_new = np.c_[x0.ravel(), x1.ravel()]

    y_predict = model.predict(X_new)
    zz = y_predict.reshape(x0.shape)

    from matplotlib.colors import ListedColormap
    custom_cmap = ListedColormap(['#EF9A9A','#FFF59D','#90CAF9'])

    plt.contourf(x0, x1, zz, linewidth=5, cmap=custom_cmap)

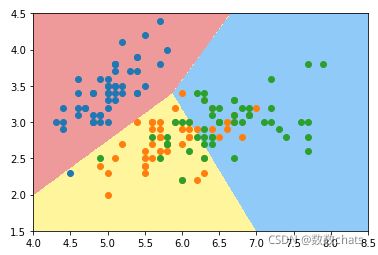
plot_decision_boundary(log_reg, axis=[4, 8.5, 1.5, 4.5])
# 可视化时只能在同一个二维平面内体现两种特征;
plt.scatter(X[y==0, 0], X[y==0, 1])
plt.scatter(X[y==1, 0], X[y==1, 1])
plt.scatter(X[y==2, 0], X[y==2, 1])
plt.show()
log_reg2 = LogisticRegression(multi_class='multinomial', solver='newton-cg')
# 'multinomial':指 OvO 方法;

log_reg2.fit(X_train, y_train)
print(log_reg2.score(X_test, y_test))
# 准确率:0.7894736842105263


plot_decision_boundary(log_reg2, axis=[4, 8.5, 1.5, 4.5])
plt.scatter(X[y==0, 0], X[y==0, 1])
plt.scatter(X[y==1, 0], X[y==1, 1])
plt.scatter(X[y==2, 0], X[y==2, 1])
plt.show()
OvR
X = iris.data
y = iris.target

X_train, X_test, y_train, y_test = train_test_split(X, y, random_state=666)

log_reg_ovr = LogisticRegression()
log_reg_ovr.fit(X_train, y_train)
log_reg_ovr.score(X_test, y_test)
OvO
log_reg_ovo = LogisticRegression(multi_class='multinomial', solver='newton-cg')
log_reg_ovo.fit(X_train, y_train)
log_reg_ovo.score(X_test, y_test)
逻辑回归其他参数
1、max_iter学习曲线
参数max_iter最大迭代次数来代替步长,帮助我们控制模型的迭代速度并适时地让模型停下。maxiter越大,代表步长越小,模型迭代时间越长,反之,则代表步长设置很大,模型迭代时间很短。
from sklearn.datasets import load_breast_cancer
from sklearn.model_selection import train_test_split
from sklearn.metrics import accuracy_score
from sklearn.linear_model import LogisticRegression as LR
from matplotlib import  pyplot as plt
import numpy as np

data = load_breast_cancer()
x = data.data
y = data.target
#print(x.shape)  #(569, 30)
#print(y.shape)  #(569,)

xtrain, xtest, ytrain, ytest = train_test_split(x, y, test_size=0.3, random_state=0)

lr1 = []
lr1test = []
for i in range(1, 201, 10):
    LR_ = LR(penalty='l1', solver='liblinear', C=0.8, max_iter=i)
    lr = LR_.fit(xtrain, ytrain)
    score_1 = accuracy_score(lr.predict(xtrain), ytrain)
    lr1.append(score_1)
    l1test = LR_.fit(xtest, ytest)
    score_2 = accuracy_score(lr.predict(xtest), ytest)
    lr1test.append(score_2)

graph = [lr1, lr1test]
color = ['black', 'red']
label = ['l1', 'l1test']
plt.figure(figsize=(20, 5))
for i in range(2):
    plt.plot(np.arange(1, 201, 10), graph[i], color[i], label=label[i])
plt.legend()
plt.xticks(np.arange(1, 201, 10))
plt.show()

可以使用属性.n_iter_米调用本次求解中真正实现的迭代次数,如果迭代过程中已经找到损失函数的最小值,会按此时的max_iter值,并不再迭代
#我的可以使用间性.n_iter_米调用本洗求解中育正实理的进代次数
lr=LR(penalty='l2',solver='liblinear',C=0.8,max_iter=200).fit(xtrain,ytrain)
lr.n_iter_
#array([20], dtype=int32)
当max_iter中限制的步数已经走完了,逻辑回归却还没有找到损失函数的最小值,参数的值还没有被收敛,sklearn就会弹出这样的红色警告:
#我的可以使用间性.n_iter_米调用本洗求解中育正实理的进代次数
lr=LR(penalty='l2',solver='liblinear',C=0.8,max_iter=10).fit(xtrain,ytrain)
lr.n_iter_

这是在提醒我们:参数没有收敛,请增大max_iter中输入的数字。但我们不一定要听sklearn的。max_iter很大,意味着步长小,模型运行得会更加缓慢。虽然我们在梯度下降中追求的是损失函数的最小值,但这也可能意味着我们的模型会过拟合(在训练集上表现得太好,在测试集上却不一定),因此,如果在max_iter报红条的情况下,模型的训练和预测效果都已经不错了,那我们就不需要再增大max_iter中的数目了,毕竟一切都以模型的预测效果为基准——只要最终的预测效果好,运行又快,那就一切都好,无所谓是否报红色警告了。
2、solver 求解器的选择
3、 class_weight:样本不平衡与参数
样本不平衡是指在一组数据集中,标签的一类天生占有很大的比例,或误分类的代价很高,即我们想要捕捉出某种特定的分类的时候的状况。什么情况下误分类的代价很高?例如,在银行要判断“一个新客户是否会违约”,通常不违约的人vs违约的人会是99:1的比例,真正违约的人其实是非常少的。这种分类状况下,即便模型什么也不做,全把所有人都当成不会违约的人,正确率也能有99%,这使得模型评估指标变得毫无意义,根本无法达到我们的“要识别出会违约的人”的建模目的。
因此我们要使用参数class_weight对样本标签进行一定的均衡,给少量的标签更多的权重,让模型更偏向少数类,向捕获少数类的方向建模。该参数默认None,此模式表示自动给与数据集中的所有标签相同的权重,即自动1:1。当误分类的代价很高的时候,我们使用”balanced“模式,我们只是希望对标签进行均衡的时候,什么都不填就可以解决样本不均衡问题。
但是,sklearn当中的参数class_weight变幻莫测,大家用模型跑一跑就会发现,我们很难去找出这个参数引导的模型趋势,或者画出学习曲线来评估参数的效果,因此可以说是非常难用。我们有着处理样本不均衡的各种方法,其中主流的是采样法,是通过重复样本的方式来平衡标签,可以进行上采样(增加少数类的样本),比如SMOTE,或者下采样(减少多数类的样本)。对于逻辑回归来说,上采样是最好的办法。
