【机器学习】4. 线性模型 - Logistic回归&线性支持向量机
上一篇:Lasso
文章目录
- 用于分类的线性模型
- 利用forge数据集
-
- 完整代码
- 利用cancer数据集
-
- 完整代码
用于分类的线性模型
线性模型也广泛应用于分类问题。我们首先来看二分类。这时可以利用下面的公式进行预测:
y ^ = w [ 0 ] ∗ x [ 0 ] + w [ 1 ] ∗ x [ 1 ] + ⋯ + w [ p ] ∗ x [ p ] + b > 0 \hat{y} = w[0] * x[0] + w[1] * x[1] + \cdots + w[p] * x[p] + b > 0 y^=w[0]∗x[0]+w[1]∗x[1]+⋯+w[p]∗x[p]+b>0
这个公式看起来与线性回归的公式非常相似,但我们没有返回特征的加权求和,而是为预测设置了阈值(0)。
-
如果函数值小于0,我们就预测类别-1;
-
如果函数值大于0,我们就预测类别+1。
对于所有用于分类的线性模型,这个预测规则都是通用的。同样,有很多种不同的方法来找出系数(w)和截距(b)。 -
对于用于回归的线性模型,输出ŷ是特征的线性函数,是直线、平面或超平面(对于更高维的数据集)。
-
对于用于分类的线性模型,决策边界是输入的线性函数。
换句话说,(二元)线性分类器是利用直线、平面或超平面来分开两个类别的分类器.
学习线性模型有很多种算法。这些算法的区别在于以下两点:
- 系数和截距的特定组合对训练数据拟合好坏的度量方法;
- 是否使用正则化,以及使用哪种正则化方法。
不同的算法使用不同的方法来度量“对训练集拟合好坏”。由于数学上的技术原因,不可能调节w和b使得算法产生的误分类数量最少。对于我们的目的,以及对于许多应用而言,上面第一点(称为损失函数)的选择并不重要。
最常见的两种线性分类算法是Logistic回归(logistic regression)和线性支持向量机(linear support vector machine,线性SVM),前者在linearmodel.LogisticRegression中实现,后者在svm.LinearSVC(SVC代表支持向量分类器)中实现。虽然LogisticRegression的名字中含有回归(regression),但它是一种分类算法,并不是回归算法,不应与LinearRegression混淆。
利用forge数据集
我们可以将LogisticRegression和LinearSVC模型应用到forge数据集上,并将线性模型找到的决策边界可视化:
from sklearn.linear_model import LogisticRegression
from sklearn.svm import LinearSVC
import mglearn as mglearn
import matplotlib.pyplot as plt

X, y = mglearn.datasets.make_forge()
fig, axes = plt.subplots(1, 2, figsize=(10, 3))

for model, ax in zip([LinearSVC(), LogisticRegression()], axes):
    clf = model.fit(X, y)
    mglearn.plots.plot_2d_separator(
        clf, X, fill=False, eps=0.5, ax=ax, alpha=.7
    )
    mglearn.discrete_scatter(X[:, 0], X[:, 1], y, ax=ax)
    ax.set_title("{}".format(clf.__class__.__name__))
    ax.set_xlabel("Feature 0")
    ax.set_ylabel("Feature 1")

axes[0].legend()

plt.show()
 在这张图中,forge数据集的第一个特征位于x轴,第二个特征位于y轴,与前面相同。图中分别展示了LinearSVC和LogisticRegression得到的决策边界,都是直线,将顶部归为类别1的区域和底部归为类别0的区域分开了。换句话说,对于每个分类器而言,位于黑线上方的新数据点都会被划为类别1,而在黑线下方的点都会被划为类别0。
两个模型得到了相似的决策边界。注意,两个模型中都有两个点的分类是错误的。两个模型都默认使用L2正则化,就像Ridge对回归所做的那样。
对于LogisticRegression和LinearSVC,决定正则化强度的权衡参数叫作C。
C值越大,对应的正则化越弱。
如果参数C值较大,那么LogisticRegression和LinearSVC将尽可能将训练集拟合到最好,而如果C值较小,那么模型更强调使系数向量w接近于0。
参数C的作用还有另一个有趣之处。较小的C值可以让算法尽量适应“大多数”数据点,而较大的C值更强调每个数据点都分类正确的重要性。下面是使用LinearSVC的图示:
mglearn.plots.plot_linear_svc_regularization()

在左侧的图中,C值很小,对应强正则化。大部分属于类别0的点都位于底部,大部分属于类别1的点都位于顶部。强正则化的模型会选择一条相对水平的线,有两个点分类错误。
在中间的图中,C值稍大,模型更关注两个分类错误的样本,使决策边界的斜率变大。
在右侧的图中,模型的C值非常大,使得决策边界的斜率也很大,现在模型对类别0中所有点的分类都是正确的。类别1中仍有一个点分类错误,这是因为对这个数据集来说,不可能用一条直线将所有点都分类正确。右侧图中的模型尽量使所有点的分类都正确,但可能无法掌握类别的整体分布。换句话说,这个模型很可能过拟合。
与回归的情况类似,用于分类的线性模型在低维空间中看起来可能非常受限,决策边界只能是直线或平面。同样,在高维空间中,用于分类的线性模型变得非常强大,当考虑更多特征时,避免过拟合变得越来越重要。
完整代码
from sklearn.linear_model import LogisticRegression
from sklearn.svm import LinearSVC
import mglearn as mglearn
import matplotlib.pyplot as plt

X, y = mglearn.datasets.make_forge()

# fig, axes = plt.subplots(1, 2, figsize=(10, 3))
#
# for model, ax in zip([LinearSVC(), LogisticRegression()], axes):
#     clf = model.fit(X, y)
#     mglearn.plots.plot_2d_separator(
#         clf, X, fill=False, eps=0.5, ax=ax, alpha=.7
#     )
#     mglearn.discrete_scatter(X[:, 0], X[:, 1], y, ax=ax)
#     ax.set_title("{}".format(clf.__class__.__name__))
#     ax.set_xlabel("Feature 0")
#     ax.set_ylabel("Feature 1")
#
# axes[0].legend()
# plt.show()

mglearn.plots.plot_linear_svc_regularization()
plt.show()
利用cancer数据集
我们在乳腺癌数据集上详细分析LogisticRegression:
from sklearn.datasets import load_breast_cancer
from sklearn.model_selection import train_test_split
from sklearn.linear_model import LogisticRegression

cancer = load_breast_cancer()
X_train, X_test, y_train, y_test = train_test_split(
    cancer.data, cancer.target, stratify=cancer.target, random_state=42
)
logreg = LogisticRegression().fit(X_train, y_train)

# 训练集和测试集性能
print("Training set score: {:.3f}".format(logreg.score(X_train, y_train)))
print("Test set score: {:.3f}".format(logreg.score(X_test, y_test)))

===================================================
Training set score: 0.948
Test set score: 0.958
C=1的默认值给出了相当好的性能,在训练集和测试集上都达到95%的精度。但由于训练集和测试集的性能非常接近,所以模型很可能是欠拟合的。我们尝试增大C来拟合一个更灵活的模型:
logreg100 = LogisticRegression(C=100).fit(X_train, y_train)

# 训练集和测试集性能
print("Training set score: {:.3f}".format(logreg100.score(X_train, y_train)))
print("Test set score: {:.3f}".format(logreg100.score(X_test, y_test)))
=============================================
Training set score: 0.944
Test set score: 0.958
使用C=100可以得到更高的训练集精度,也得到了稍高的测试集精度
这里我的数据如上,没有得到更高的精度,之前运行有飘红的情况出现,但是得出了结果我也就没有在意。
报错信息:STOP: TOTAL NO. of ITERATIONS REACHED LIMIT. Increase the number of iterations (max_iter) or scale the data as shown in: https://scikit-learn.org/stable/modules/preprocessing.html Please also refer to the documentation for alternative solver options: https://scikit-learn.org/stable/modules/linear_model.html#logistic-regression extra_warning_msg=_LOGISTIC_SOLVER_CONVERGENCE_MSG,得知时迭代次数不够,加上参数
max_iter=10000就好了,如上代码logreg100 = LogisticRegression(C=100, max_iter=10000).fit(X_train, y_train) # 训练集和测试集性能 print("Training set score: {:.3f}".format(logreg100.score(X_train, y_train))) print("Test set score: {:.3f}".format(logreg100.score(X_test, y_test))) ======================================= Training set score: 0.981 Test set score: 0.972
我们还可以研究使用正则化更强的模型时会发生什么。设置C=0.01:
logreg001 = LogisticRegression(C=0.01, max_iter=10000).fit(X_train, y_train)

# 训练集和测试集性能
print("Training set score: {:.3f}".format(logreg001.score(X_train, y_train)))
print("Test set score: {:.3f}".format(logreg001.score(X_test, y_test)))

=============================================
Training set score: 0.953
Test set score: 0.951
正如我们所料,在图中将已经欠拟合的模型继续向左移动,训练集和测试集的精度都比采用默认参数时更小。
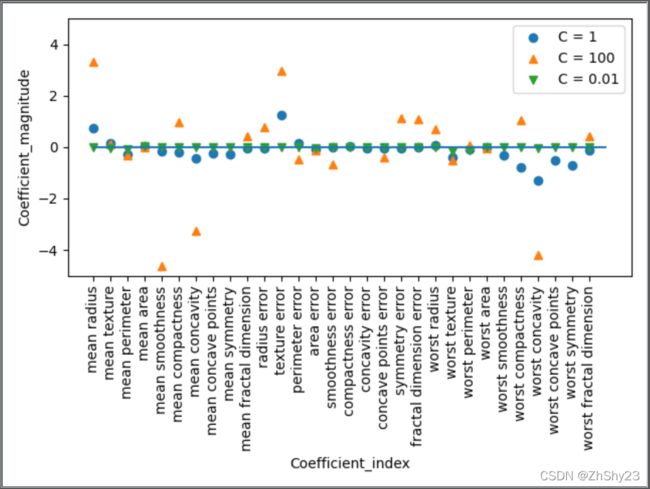
最后,来看一下正则化参数C取三个不同的值时模型学到的系数
plt.plot(logreg.coef_.T, 'o', label="C = 1")
plt.plot(logreg100.coef_.T, '^', label="C = 100")
plt.plot(logreg001.coef_.T, 'v', label="C = 0.01")

plt.xticks(range(cancer.data.shape[1]), cancer.feature_names, rotation=90)
plt.hlines(0, 0, cancer.data.shape[1])
plt.ylim(-5, 5)
plt.xlabel("Coefficient_index")
plt.ylabel("Coefficient_magnitude")
plt.legend()

plt.show()

由于LogisticRegression默认应用L2正则化,所以其结果与Ridge的结果类似。
更强的正则化使得系数更趋向于0,但系数永远不会正好等于0。
进一步观察图像,还可以在第3个系数那里发现有趣之处,这个系数是“平均周长”(mean perimeter)。
- C=100和C=1时,这个系数为负,
- 而C=0.001时这个系数为正,其绝对值比C=1时还要大。
在解释这样的模型时,人们可能会认为,系数可以告诉我们某个特征与哪个类别有关。
例如,人们可能会认为高“纹理错误”(texture error)特征与“恶性”样本有关。但“平均周长”系数的正负号发生变化,说明较大的“平均周长”可以被当作“良性”的指标或“恶性”的指标,具体取决于我们考虑的是哪个模型。这也说明,对线性模型系数的解释应该始终持保留态度。
如果想要一个可解释性更强的模型,使用L1正则化可能更好,因为它约束模型只使用少数几个特征。下面是使用L1正则化的系数图像和分类精度:
for C, marker in zip([0.001, 1, 100], ['o', '^', 'v']):
    lr_l1 = LogisticRegression(C=C, max_iter=10000).fit(X_train, y_train)
    print("\nTraining accuracy of l1_logreg with C = {:.3f}: {:.2f}".format(
        C, lr_l1.score(X_train, y_train)))
    print("Test accuracy of l1_logreg with C = {:.3f}: {:.2f}".format(
        C, lr_l1.score(X_test, y_test)))

    plt.plot(lr_l1.coef_.T, marker, label="C = {:.3f}".format(C))

plt.xticks(range(cancer.data.shape[1]), cancer.feature_names, rotation=90)
plt.hlines(0, 0, cancer.data.shape[1])
plt.ylim(-5, 5)
plt.xlabel("Coefficient_index")
plt.ylabel("Coefficient_magnitude")
plt.legend(loc=3)

plt.show()

==============================================

Training accuracy of l1_logreg with C = 0.001: 0.95
Test accuracy of l1_logreg with C = 0.001: 0.94

Training accuracy of l1_logreg with C = 1.000: 0.96
Test accuracy of l1_logreg with C = 1.000: 0.96

Training accuracy of l1_logreg with C = 100.000: 0.98
Test accuracy of l1_logreg with C = 100.000: 0.97

如你所见,用于二分类的线性模型与用于回归的线性模型有许多相似之处。与用于回归的线性模型一样,模型的主要差别在于penalty参数,这个参数会影响正则化,也会影响模型是使用所有可用特征还是只选择特征的一个子集。
完整代码
from sklearn.datasets import load_breast_cancer
from sklearn.model_selection import train_test_split
from sklearn.linear_model import LogisticRegression
import matplotlib.pyplot as plt

cancer = load_breast_cancer()
X_train, X_test, y_train, y_test = train_test_split(
    cancer.data, cancer.target, stratify=cancer.target, random_state=42
)

#################### LogisticRegression
########## LogisticRegression_C = 1
logreg = LogisticRegression(max_iter=10000).fit(X_train, y_train)

# 训练集和测试集性能
print("\nLogisticRegression_C = 1")
print("Training set score: {:.3f}".format(logreg.score(X_train, y_train)))
print("Test set score: {:.3f}".format(logreg.score(X_test, y_test)))

########## LogisticRegression_C = 100
logreg100 = LogisticRegression(C=100, max_iter=10000).fit(X_train, y_train)

# 训练集和测试集性能
print("\nLogisticRegression_C = 100")
print("Training set score: {:.3f}".format(logreg100.score(X_train, y_train)))
print("Test set score: {:.3f}".format(logreg100.score(X_test, y_test)))

########## LogisticRegression_C = 0.01
logreg001 = LogisticRegression(C=0.01, max_iter=10000).fit(X_train, y_train)

# 训练集和测试集性能
print("\nLogisticRegression_C = 0.01")
print("Training set score: {:.3f}".format(logreg001.score(X_train, y_train)))
print("Test set score: {:.3f}".format(logreg001.score(X_test, y_test)))

# #################### 制图
# plt.plot(logreg.coef_.T, 'o', label="C = 1")
# plt.plot(logreg100.coef_.T, '^', label="C = 100")
# plt.plot(logreg001.coef_.T, 'v', label="C = 0.01")
#
# plt.xticks(range(cancer.data.shape[1]), cancer.feature_names, rotation=90)
# plt.hlines(0, 0, cancer.data.shape[1])
# plt.ylim(-5, 5)
# plt.xlabel("Coefficient_index")
# plt.ylabel("Coefficient_magnitude")
# plt.legend()
#
# plt.show()

for C, marker in zip([0.001, 1, 100], ['o', '^', 'v']):
    lr_l1 = LogisticRegression(C=C, max_iter=10000).fit(X_train, y_train)
    print("\nTraining accuracy of l1_logreg with C = {:.3f}: {:.2f}".format(
        C, lr_l1.score(X_train, y_train)))
    print("Test accuracy of l1_logreg with C = {:.3f}: {:.2f}".format(
        C, lr_l1.score(X_test, y_test)))

    plt.plot(lr_l1.coef_.T, marker, label="C = {:.3f}".format(C))

plt.xticks(range(cancer.data.shape[1]), cancer.feature_names, rotation=90)
plt.hlines(0, 0, cancer.data.shape[1])
plt.ylim(-5, 5)
plt.xlabel("Coefficient_index")
plt.ylabel("Coefficient_magnitude")
plt.legend(loc=3)

plt.show()