python配色_Python数据分析之Seaborn(配色方案)


Seaborn配色方案
配色是图表设计里最重要的方面之一,因为如果配色方案好,它可以清晰展现数据的模式和规律,否则就会把这些规律和模式隐藏起来。Seaborn让选择和使用配色方案变得简单且适用于你工作的数据种类和你想要达到的可视化目标。
import numpy as npimport seaborn as snsimport matplotlib.pyplot as plt%matplotlib inlinesns.set(rc={"figure.figsize": (6, 6)})
调色板
颜色很重要
color_palette()能传入任何Matplotlib所支持的颜色
color_palette()不写参数则默认颜色
set_palette()设置所有图的颜色
分类色板
current_palette = sns.color_palette()sns.palplot(current_palette)

6个默认的颜色循环主题: deep, muted, pastel, bright, dark, colorblind.
圆形画板
当你有六个以上的分类要区分时,最简单的方法就是在一个圆形的颜色空间中画出均匀间隔的颜色(这样的色调会保持亮度和饱和度不变)。这是大多数的当他们需要使用比当前默认颜色循环中设置的颜色更多时的默认方案。最常用的方法是使用hls的颜色空间,这是RGB值的一个简单转换。
sns.palplot(sns.color_palette("hls", 8))

#应用调色板data = np.random.normal(size=(20, 8)) + np.arange(8) / 2 #生成数据sns.boxplot(data=data,palette=sns.color_palette("hls", 8))#按照生成的颜色对应不同的分类
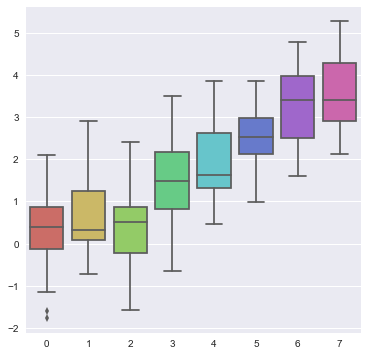
hls_palette()函数来控制颜色的亮度和饱和
l-亮度 lightness
s-饱和 saturation
sns.palplot(sns.hls_palette(8, l=.7, s=.9))

sns.palplot(sns.color_palette("Paired",8))

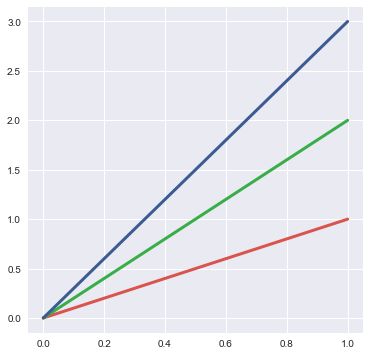
使用xkcd颜色自定义调色板
xkcd包含了一套众包努力的针对随机RGB色的命名。产生了954个可以随时通过xdcd_rgb字典中调用的命名颜色。可以通过sns.xkcd_rgb进行查看。
plt.plot([0, 1], [0, 1], sns.xkcd_rgb["pale red"], lw=3)plt.plot([0, 1], [0, 2], sns.xkcd_rgb["medium green"], lw=3)plt.plot([0, 1], [0, 3], sns.xkcd_rgb["denim blue"], lw=3)
[]
colors = ["windows blue", "amber", "greyish", "faded green", "dusty purple"]sns.palplot(sns.xkcd_palette(colors))

连续色板
色彩随数据变换,比如数据越来越重要则颜色越来越深
sns.palplot(sns.color_palette("Blues"))

如果想要翻转渐变,可以在面板名称中添加一个_r后缀
sns.palplot(sns.color_palette("BuGn_r"))

cubehelix_palette()调色板
色调线性变换
sns.palplot(sns.color_palette("cubehelix", 8))

sns.palplot(sns.cubehelix_palette(8, start=.5, rot=-.75))

sns.palplot(sns.cubehelix_palette(8, start=1.75, rot=-.150))

light_palette() 和dark_palette()调用定制连续调色板
sns.palplot(sns.light_palette("green"))

sns.palplot(sns.dark_palette("purple"))

sns.palplot(sns.light_palette("navy", reverse=True)) #渐变翻转

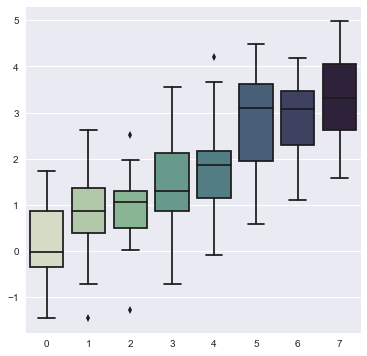
#应用调色板data = np.random.normal(size=(20, 8)) + np.arange(8) / 2 #生成数据sns.boxplot(data=data,palette=sns.cubehelix_palette(8, start=.5, rot=-.75))#按照生成的颜色对应不同的分类
参考
[Style functions]http://seaborn.pydata.org/tutorial/aesthetics.html#aesthetics-tutorial
[Color palettes]http://seaborn.pydata.org/tutorial/color_palettes.html#palette-tutorial
[Distribution plots]http://seaborn.pydata.org/tutorial/distributions.html#distribution-tutorial
[Categorical plots]http://seaborn.pydata.org/tutorial/categorical.html#categorical-tutorial
[Regression plots]http://seaborn.pydata.org/tutorial/regression.html#regression-tutorial
[Axis grid objects]http://seaborn.pydata.org/tutorial/axis_grids.html#grid-tutorial[10分钟python图表绘制]https://zhuanlan.zhihu.com/p/24464836
