场景文字检测——CTPN模型介绍及代码实现
一、CTPN文字检测的概述
CTPN:Detecting Text in Natural Image with Connectionist Text Proposal Network,(即使用连接的文本建议框网络进行自然图像的文本检测),是在ECCV 2016提出的一种文字检测算法。CTPN是结合CNN与LSTM的深度网络,能有效的检测出复杂场景的横向分布的文字。CTPN是从Faster RCNN改进而来,因此也是基于anchor的目标检测网络,网络架构和Faster RCNN相似,但是加入了LSTM层,其支持任意尺寸的图像输入,并能够直接在卷积层中定位文本行。即由特征提取网络VGG+连接的文本候选框选取CTPN构成。

二、CTPN模型架构

CTPN的主干特征提取网络采用了VGG16的卷积部分,通过卷积不断进行下采样,下采样的步长为16,即得到VGG的conv5的特征图;后面部分便是改进的RPN网络CTPN网络,即连接的文本建议框网络;首先在conv5特征图上做3x3的滑动窗口,来产生学习到的空间特征;由于文本具有较强的序列特征,将特征进行Reshape操作后传入双向的LSTM网络,得到上下文的编码信息;然后再进行“FC”卷积层,也就是进行特征通道数的调整;最后是传入到CTPN的预测网络(三个分支),第一个分支的输出通道数为2xk vertical coordinates,k为anchor的数量,2分别表示预测框中心y轴和高度h的偏移量;第二个分支的输出通道数2xk scores,k为anchor的数量,2表示anchor是前景还是背景;第三个分支的输出通道数1xk side-refinement,k为anchor的数量,1表示水平方向上左边或者右边预测框中心点x轴的偏移量。
1、主干网络VGG16
VGG16是2014年ImageNet上提出的非常优秀的分类网络,其主要特征就是采样小的卷积核3x3不断进行特征提取以及最大池化进行下采样,通道数的变化采用了network in network的思想,其具体结构如下:
![]()
图片输入:原始VGG分类网络图片的输入为224x224,论文中将输入图片的最短边Reshape到600,因此下面以600x800来描述图片shape的变化。
conv1:经过两次的3x3卷积,输出通道数为64,shape为[64,600,800],再经过一次pool_size为2的最大池化,shape变为[64,300,400]。
conv2:两次3x3卷积,输出的通道数为128,shape为(128,300,400),再经过一次pool_size为2最大池化,输出shape为(128,150,200)。
conv3:三次3x3卷积,输出的通道数为256,shape为(256,150,200),再经过一次pool_size为2最大池化,输出shape为(256,75,100)。
conv4:三次3x3卷积,输出的通道数为512,shape为(512,75,100),再经过一次pool_size为2最大池化,输出shape为(512,37,50)。
conv5:三次3x3卷积,输出的通道数为512,shape为(512,37,50)。
VGG16网络的详细信息可以参考这篇博客https://blog.csdn.net/weixin_44791964/article/details/102585038
后面我们将得到的conv5(batch,512,37,50)的特征层称之为有效特征层,这与Faster RCNN的中的feature map是一样的。之后的CTPN网络便是作用在该有效特征图上。
import os
import torch
import torch.nn as nn
import torch.nn.functional as F
import torchvision.models as models

class CTPN_Model(nn.Module):
    def __init__(self):
        super().__init__()
        base_model = models.vgg16(pretrained=False)
        layers = list(base_model.features)[:-1]
        self.base_layers = nn.Sequential(*layers)  # block5_conv3 output
2、CTPN连接的文本建议框网络
类似于区域建议框网络(RPN)[25],CTPN本质上是一个全卷积网络,允许任意大小的输入图像。
(1)原论文中,CTPN网络首先在conv5上做3x3的滑动窗口,即每个点都结合3x3区域特征获得一个长度为3x3x512的特征向量。输出(batch,9x512,37,50)的特征图,使网络学习到空间的特征。
这里解释一下conv5 feature map如何从(batch,512,37,50)变成(batch,9x512,37,50):
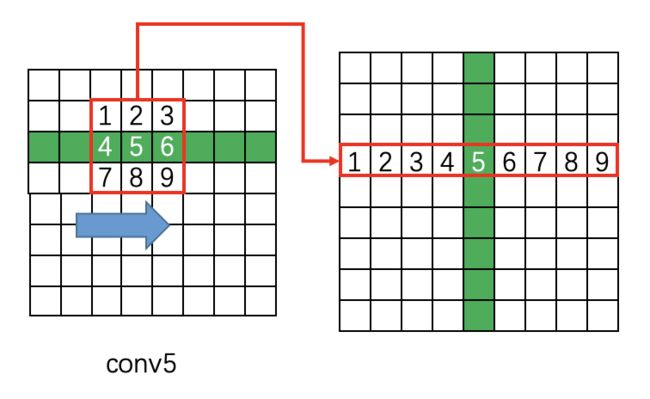
在原版caffe代码中是用im2col提取每个点附近的9点临近点,然后每行都如此处理:
37x50 -> 9x37x50
接着每个通道都如此处理:
512x37x50 -> 9*512x37x50
而im2col是用于卷积加速的操作,即将卷积变为矩阵乘法,从而使用Blas库快速计算。
但是这里我们并没有遵循原始论文的做法,而是采用了一个3x3x512的卷积操作来替代上述的空间特征提取。特征层shape由(batch,512,37,50)–>(batch,512,37,50)
import os
import torch
import torch.nn as nn
import torch.nn.functional as F
import torchvision.models as models

class CTPN_Model(nn.Module):
    def __init__(self):
        super().__init__()
        base_model = models.vgg16(pretrained=False)
        layers = list(base_model.features)[:-1]
        self.base_layers = nn.Sequential(*layers)  # block5_conv3 output
		#使用一个3x3卷积来替代上述的空间特征提取
         self.rpn = basic_conv(512, 512, 3, 1, 1, bn=False)
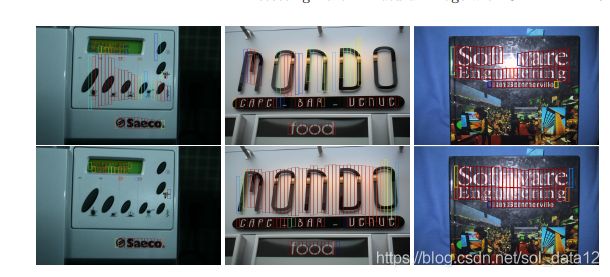
(2)CNN学习的是感受野内的空间信息,LSTM学习的是序列特征。对于文本序列检测,显然既需要CNN抽象空间特征,也需要序列特征(毕竟文字是连续的)。使用双向的LSTM,使得它能够在两个方向上对递归上下文进行编码,以便连接感受野能够覆盖整个图像宽度。
下图显示了带有LSTM和不带有LSTM的CTPN网络的预测结果,上半部分:没有LSTM,下半部分:有LSTM,可以看到包含了上下文信息更能进行文本的精确定位。
在进入LSTM之前要进行特征层shape的变化,(batch,512,37,50)–>(batch,37,50,512)–>(batchx37,50,512),最大时间步长Time_step=50,学习每一行的序列特征。
import os
import torch
import torch.nn as nn
import torch.nn.functional as F
import torchvision.models as models

class CTPN_Model(nn.Module):
    def __init__(self):
        super().__init__()
        base_model = models.vgg16(pretrained=False)
        layers = list(base_model.features)[:-1]
        self.base_layers = nn.Sequential(*layers)  # block5_conv3 output
		# 使用一个3x3卷积来替代上述的空间特征提取
         self.rpn = basic_conv(512, 512, 3, 1, 1, bn=False)
         # 使用双向的LSTM对上下文信息进行编码
         self.brnn = nn.GRU(512,128, bidirectional=True, batch_first=True)
(3)经过双向LSTM后,特征层shape为(batchx37,50,256),再经过reshape操作,(batchx37,50,256)–>(batch,37,50,256)–>(batch,256,37,50)。“FC”卷积层使用1x1的卷积进行通道数的调整,256->521。
import os
import torch
import torch.nn as nn
import torch.nn.functional as F
import torchvision.models as models

class CTPN_Model(nn.Module):
    def __init__(self):
        super().__init__()
        base_model = models.vgg16(pretrained=False)
        layers = list(base_model.features)[:-1]
        self.base_layers = nn.Sequential(*layers)  # block5_conv3 output
		# 使用一个3x3卷积来替代上述的空间特征提取
         self.rpn = basic_conv(512, 512, 3, 1, 1, bn=False)
         # 使用双向的LSTM对上下文信息进行编码
         self.brnn = nn.GRU(512,128, bidirectional=True, batch_first=True)
         self.lstm_fc = basic_conv(256, 512, 1, 1, relu=True, bn=False)
(4)CTPN的Head层,从上述得到的特征层(batch,256,37,50),获得网络最终的预测结果。如何理解这三个分支所获得的预测结果? 不考虑batch维度,上述特征层的shape为(256,37,50),也就是可以理解为该特征层将我们输入的图片划分成了37x50的区域,每个区域都存在一个特征点,如果物体的中心点落在这个区域内的话,那么就由这个特征点来负责物体的预测。
预测网路的三个分支:
第一个分支:通过1x1x2k的卷积操作,最后输出shape为(batch,2k,37,50),
即2xk vertical coordinates,其中2代表的是相对预测框中心点坐标y和预测框的高度h的偏移量,如何理解这个相对预测框的偏移量?我们在原始图像中预先设定的很多的先验框,先验框就会根据上述预测出来的y和h的偏移量进行调整,将先验框调整称为预测框应该有的样子。k表示的是每一个特征点处设计的anchor的数量,为10。每一个区域内每一个特征点上有10个锚框来负责该区域物体的预测。
第二个分支:同样通过1x1x2k的卷积操作,最后输出shape为(batch,2k,37,50),2xk代表的是2k scores 置信度得分,其中2就是代表的就是前景或背景,即每一个特征点处10个anchors属于前景或者背景的概率值。如果该特征点属于前景,我们才会对先验框进行上述的y和h的偏移,对先验框进行下述x的偏移。
第三个分支:通过1x1xk的卷积操作,最后输出shape为(batch,k,37,50),k side refinement代表的是左右两侧水平方向上每个锚框中心点x坐标的偏移量,用于提高定位的准确性。
import os
import torch
import torch.nn as nn
import torch.nn.functional as F
import torchvision.models as models

class CTPN_Model(nn.Module):
    def __init__(self):
        super().__init__()
        base_model = models.vgg16(pretrained=False)
        layers = list(base_model.features)[:-1]
        self.base_layers = nn.Sequential(*layers)  # block5_conv3 output
		# 使用一个3x3卷积来替代上述的空间特征提取
         self.rpn = basic_conv(512, 512, 3, 1, 1, bn=False)
         # 使用双向的LSTM对上下文信息进行编码
         self.brnn = nn.GRU(512,128, bidirectional=True, batch_first=True)
         self.lstm_fc = basic_conv(256, 512, 1, 1, relu=True, bn=False)
         self.rpn_class = basic_conv(512, 10 * 2, 1, 1, relu=False, bn=False)
        self.rpn_regress = basic_conv(512, 10 * 2, 1, 1, relu=False, bn=False)
        self.rpn_refiment = basic_conv(512, 10, 1, 1, relu=False, bn=False)

    def forward(self, x):
        x = self.base_layers(x)
        # rpn
        x = self.rpn(x)    #[b, c, h, w]

        x1 = x.permute(0,2,3,1).contiguous()  # channels last   [b, h, w, c]
        b = x1.size()  # b, h, w, c
        x1 = x1.view(b[0]*b[1], b[2], b[3])

        x2, _ = self.brnn(x1)

        xsz = x.size()
        x3 = x2.view(xsz[0], xsz[2], xsz[3], 256)  # torch.Size([4, 20, 20, 256])

        x3 = x3.permute(0,3,1,2).contiguous()  # channels first [b, c, h, w]
        x3 = self.lstm_fc(x3)
        x = x3

        cls = self.rpn_class(x)
        regr = self.rpn_regress(x)
        refi = self.rpn_refiment(x)

        cls = cls.permute(0,2,3,1).contiguous()     # [b,h,w,c]
        regr = regr.permute(0,2,3,1).contiguous()
        refi = refi.permute(0,2,3,1).contiguous()

        cls = cls.view(cls.size(0), cls.size(1)*cls.size(2)*10, 2)
        regr = regr.view(regr.size(0), regr.size(1)*regr.size(2)*10, 2)
        refi = refi.view(refi.size(0),refi.size(1)*refi.size(2)*10,1)

        return cls, regr, refi
(5)整个CTPN的detection pipeline如下:
from ctpn_model import CTPN_Model
from torchsummary import summary

model = CTPN_Model().train().cuda()
summary(model, (3, 600,800))
3、什么是anchor?——竖直的锚框机制
anchor就是我们预先在图片设定的一些列的先验框,根据VGG16得到的特征图conv,其shape为(batch,512,37,50),于是我们可以将图片划分成37x50的区域,每一个区域都存在一个特征点,每一个特征点都对应存在10个宽度相同wa=16,高度为11—273的先验框,由于CTPN针对的是横向排列的文字检测,所以其采用了一组(10个)等宽度的Anchors,用于定位文字位置。下图显示了其中一个特征点上存在的10个先验框。

为什么选择竖直的锚框机制?论文中提到,实质上文本与普通目标不同,它们通常具有明确的封闭边界和中心,可以从它的一部分推断整个目标。文本是一个没有明显封闭边界的序列。它可能包含多层次的组件,如笔划,字符,单词,文本行和文本区域等,这些组件之间没有明确区分。文本检测是在单词或文本行级别中定义的,因此通过将其定义为单个目标(例如检测单词的一部分)可能很容易进行错误的检测。因此,直接预测文本行或单词的位置可能很难或不可靠,因此很难获得令人满意的准确性。一个例子如图所示,其中RPN直接被训练用于定位图像中的文本行。

通过固定每个建议框的水平位置来预测其垂直位置会更准确,水平位置更难预测。与预测目标4个坐标的RPN相比,这减少了搜索空间。提出的竖直锚框机制,可以同时预测每个细粒度建议框的文本/非文本分数和y轴的位置。检测一般固定宽度的文本建议框比识别分隔的字符更可靠,分隔字符容易与字符或多个字符的一部分混淆。此外,检测一系列固定宽度文本建议框中的文本行也可以在多个尺度和多个长宽比的文本上可靠地工作。
产生竖直锚框的代码如下:
def gen_anchor(featuresize, scale):
    # 划分为56x100的网格点,每个网格点10个先验框
    heights = [11, 16, 23, 33, 48, 68, 97, 139, 198, 283]
    widths = [16, 16, 16, 16, 16, 16, 16, 16, 16, 16]
    # 10,1
    heights = np.array(heights).reshape(len(heights),1)
    widths = np.array(widths).reshape(len(widths), 1)
    base_anchor = np.array([0,0,15,15])
    # 计算第一个网格中心,最左上角的网格中心
    # xt=[7.5],yt=[7.5]
    xt = (base_anchor[0] + base_anchor[2]) / 2.0
    yt = (base_anchor[1] + base_anchor[3]) / 2.0
    # 转化为左上角和右下角的形式 x1 y1 x2 y2
    # 这里就是求出了最左上角的网格对应的9个初始先验框的左上角和右下角坐标
    x1 = xt - widths * 0.5
    y1 = yt - heights * 0.5
    x2 = xt + widths * 0.5
    y2 = yt + heights * 0.5
    base_anchor = np.hstack((x1, y1, x2, y2))
    # 特征图的大小 56,100
    h,w = featuresize
    # 这相当于将原图划分成56x100的网格,网格之间的步长为scale=16
    shift_x = np.arange(0, w) * scale
    shift_y = np.arange(0, h) * scale
    anchors = []
    for i in shift_y:
        for j in shift_x:
            anchors.append(base_anchor + [j,i,j,i])
    # (56x100x10,4)
    return np.array(anchors).reshape(-1,4)
三、如何根据预测结果将anchor调整,从而得到最后的预测框?
1、先验框的解码过程
根据预测网络我们可以得到三个预测结果:
第一个分支:2xk vertical coordinates,预测的是最后特征层上每一个特征点上每一个先验框中心点y轴坐标和高度h的变化情况;
第二个分支:2k scores,预测的是最后特征层上每一个特征点上每一个先验框内部是否包含物体,先验框为前景或背景的概率;
第三个分支:k side refinement,预测的是左右两侧水平方向上每一个特征点上每一个先验框中心点x坐标的变化情况;
先验框就是,根据最后特征层将整个图片划分成37x50的区域,每一个区域对应一个特征点,以该特征点为中心包含了10个先验框,一共存在37x50x10个先验框。
首先根据第二个分支用于判断先验框内部是否包含物体,如果内部包含物体,则根据第一个分支和第三个分支的预测结果,将先验框进行调整,调整成预测框。如何进行调整?
![]()
上述公式中vc和vh表示的就是预测框相对于先验框中心点y轴坐标和高度的偏移量,cay和ha表示的是预先设定的先验框的中心点y轴坐标和高度,cy和h表示的是预测框的中心点y轴坐标和高度h,cy=vc*ha+cay, h=exp(vh)ha,先验框调整成预测框应该有的样子。
![]()
上述公式中o表示的就是预测框相对于先验框左右两侧水平方向上中心点x轴坐标的偏移量,cax表示的是预先设定的先验框的中心点x轴坐标,wa=16表示的是先验框的宽度,xside表示的预测框的中心点x轴坐标,xside=owa+cax,进行预测框的边缘细化,下图显示了多增加k side refinement分支的预测结果:

红色框表示增加了边缘细化,黄色虚线框表示没有边缘细化。
2、预测框的非极大抑制NMS
我们得到一系列的预测框,但是我们不可能将它们都绘制在原图上,它们中大多数都是冗余测框,大多都是指向同一物体,因此我们只需要选取其中得分最大的预测框,这就是非极大抑制NMS需要做的工作,进行预测框的后处理。
3、文本线构造算法
在上面的步骤中,已经获得了下图所示的一系列单个文本预测框,接下来就要采用文本线构造办法,把这些单个的文本预测框连接成一个整体的文本检测框。
文本线构造算法的实现步骤:
按照上述预测框水平x坐标进行排序;
正向寻找:
1、沿水平正方向,寻找和boxi水平距离小于像素的预测框(每个预测框宽度16像素,也就是最多正向寻找50/16=3个),即到boxj;
2、从预测框中,找出与boxi竖直方向重叠度overlap>0.7的预测框;
3、找出符合条件2中score得分最大的预测框;
再反向寻找:
1、沿水平负方向,寻找和boxj水平距离小于像素的预测框(每个预测框宽度16像素,也就是最多正向寻找50/16=3个),即到boxi;
2、从预测框中,找出与boxj竖直方向重叠度overlap>0.7的预测框;
3、找出符合条件2中score得分最大的预测框;
如果上述过程中,正向找到的得分最大的预测框为boxj,反向找到的得分最大的预测框为boxi;那么我们称这样找到的一个文本序列为一个最长的连接,i->j。
具体的文本线构造算法可以参见这篇文章 htps://zhuanlan.zhihu.com/p/34757009
注意文本线构造方法是在将先验框中心点y轴坐标和高度h偏移量进行调整之后,而在边缘细化之后,在我们将单个文本预测框连接成一个整体的文本预测框之后,再进行预测框两边的边缘细化。
代码如下:
# 预测框的解码过程
def bbox_transfor_inv(anchor, regr):

    # 获得先验框中心
    Cya = (anchor[:, 1] + anchor[:, 3]) * 0.5
    # 获得先验框的高
    ha = anchor[:, 3] - anchor[:, 1] + 1

    Vcx = regr[0, :, 0]
    Vhx = regr[0, :, 1]

    Cyx = Vcx * ha + Cya
    hx = np.exp(Vhx) * ha
    xt = (anchor[:, 0] + anchor[:, 2]) * 0.5

    x1 = xt - 16 * 0.5
    y1 = Cyx - hx * 0.5
    x2 = xt + 16 * 0.5
    y2 = Cyx + hx * 0.5
    bbox = np.vstack((x1, y1, x2, y2)).transpose()

    return bbox

# 非极大抑制NMS
def nms(dets, thresh):
    x1 = dets[:, 0]
    y1 = dets[:, 1]
    x2 = dets[:, 2]
    y2 = dets[:, 3]
    scores = dets[:, 4]

    areas = (x2 - x1 + 1) * (y2 - y1 + 1)
    order = scores.argsort()[::-1]

    keep = []
    while order.size > 0:
        i = order[0]
        keep.append(i)
        xx1 = np.maximum(x1[i], x1[order[1:]])
        yy1 = np.maximum(y1[i], y1[order[1:]])
        xx2 = np.minimum(x2[i], x2[order[1:]])
        yy2 = np.minimum(y2[i], y2[order[1:]])

        w = np.maximum(0.0, xx2 - xx1 + 1)
        h = np.maximum(0.0, yy2 - yy1 + 1)
        inter = w * h
        ovr = inter / (areas[i] + areas[order[1:]] - inter)

        inds = np.where(ovr <= thresh)[0]
        order = order[inds + 1]
    return keep

# 文本线构造算法
# for predict
class Graph:
    def __init__(self, graph):
        self.graph = graph

    def sub_graphs_connected(self):
        sub_graphs = []
        for index in range(self.graph.shape[0]):
            if not self.graph[:, index].any() and self.graph[index, :].any():
                v = index
                sub_graphs.append([v])
                while self.graph[v, :].any():
                    v = np.where(self.graph[v, :])[0][0]
                    sub_graphs[-1].append(v)
        return sub_graphs


class TextLineCfg:
    SCALE = 600
    MAX_SCALE = 1200
    TEXT_PROPOSALS_WIDTH = 16
    MIN_NUM_PROPOSALS = 2
    MIN_RATIO = 0.5
    LINE_MIN_SCORE = 0.9
    MAX_HORIZONTAL_GAP = 60
    TEXT_PROPOSALS_MIN_SCORE = 0.7
    TEXT_PROPOSALS_NMS_THRESH = 0.3
    MIN_V_OVERLAPS = 0.6
    MIN_SIZE_SIM = 0.6


class TextProposalGraphBuilder:
    """
        Build Text proposals into a graph.
    """

    def get_successions(self, index):
        box = self.text_proposals[index]
        results = []
        for left in range(int(box[0]) + 1, min(int(box[0]) + TextLineCfg.MAX_HORIZONTAL_GAP + 1, self.im_size[1])):
            adj_box_indices = self.boxes_table[left]
            for adj_box_index in adj_box_indices:
                if self.meet_v_iou(adj_box_index, index):
                    results.append(adj_box_index)
            if len(results) != 0:
                return results
        return results

    def get_precursors(self, index):
        box = self.text_proposals[index]
        results = []
        for left in range(int(box[0]) - 1, max(int(box[0] - TextLineCfg.MAX_HORIZONTAL_GAP), 0) - 1, -1):
            adj_box_indices = self.boxes_table[left]
            for adj_box_index in adj_box_indices:
                if self.meet_v_iou(adj_box_index, index):
                    results.append(adj_box_index)
            if len(results) != 0:
                return results
        return results

    def is_succession_node(self, index, succession_index):
        precursors = self.get_precursors(succession_index)
        if self.scores[index] >= np.max(self.scores[precursors]):
            return True
        return False

    def meet_v_iou(self, index1, index2):
        def overlaps_v(index1, index2):
            h1 = self.heights[index1]
            h2 = self.heights[index2]
            y0 = max(self.text_proposals[index2][1], self.text_proposals[index1][1])
            y1 = min(self.text_proposals[index2][3], self.text_proposals[index1][3])
            return max(0, y1 - y0 + 1) / min(h1, h2)

        def size_similarity(index1, index2):
            h1 = self.heights[index1]
            h2 = self.heights[index2]
            return min(h1, h2) / max(h1, h2)

        return overlaps_v(index1, index2) >= TextLineCfg.MIN_V_OVERLAPS and \
               size_similarity(index1, index2) >= TextLineCfg.MIN_SIZE_SIM

    def build_graph(self, text_proposals, scores, im_size):
        self.text_proposals = text_proposals
        self.scores = scores
        self.im_size = im_size
        self.heights = text_proposals[:, 3] - text_proposals[:, 1] + 1

        boxes_table = [[] for _ in range(self.im_size[1])]
        for index, box in enumerate(text_proposals):
            boxes_table[int(box[0])].append(index)
        self.boxes_table = boxes_table

        graph = np.zeros((text_proposals.shape[0], text_proposals.shape[0]), np.bool)

        for index, box in enumerate(text_proposals):
            successions = self.get_successions(index)
            if len(successions) == 0:
                continue
            succession_index = successions[np.argmax(scores[successions])]
            if self.is_succession_node(index, succession_index):
                # NOTE: a box can have multiple successions(precursors) if multiple successions(precursors)
                # have equal scores.
                graph[index, succession_index] = True
        return Graph(graph)


class TextProposalConnectorOriented:
    """
        Connect text proposals into text lines
    """

    def __init__(self):
        self.graph_builder = TextProposalGraphBuilder()

    def group_text_proposals(self, text_proposals, scores, im_size):
        graph = self.graph_builder.build_graph(text_proposals, scores, im_size)
        return graph.sub_graphs_connected()

    def fit_y(self, X, Y, x1, x2):
        # len(X) != 0
        # if X only include one point, the function will get line y=Y[0]
        if np.sum(X == X[0]) == len(X):
            return Y[0], Y[0]
        p = np.poly1d(np.polyfit(X, Y, 1))
        return p(x1), p(x2)

    def get_text_lines(self, text_proposals, scores, im_size):
        """
        text_proposals:boxes
        """
        # tp=text proposal
        tp_groups = self.group_text_proposals(text_proposals, scores, im_size)  # 首先还是建图,获取到文本行由哪几个小框构成

        text_lines = np.zeros((len(tp_groups), 8), np.float32)

        for index, tp_indices in enumerate(tp_groups):
            text_line_boxes = text_proposals[list(tp_indices)]  # 每个文本行的全部小框
            X = (text_line_boxes[:, 0] + text_line_boxes[:, 2]) / 2  # 求每一个小框的中心x,y坐标
            Y = (text_line_boxes[:, 1] + text_line_boxes[:, 3]) / 2

            z1 = np.polyfit(X, Y, 1)  # 多项式拟合,根据之前求的中心店拟合一条直线(最小二乘)

            x0 = np.min(text_line_boxes[:, 0])  # 文本行x坐标最小值
            x1 = np.max(text_line_boxes[:, 2])  # 文本行x坐标最大值

            offset = (text_line_boxes[0, 2] - text_line_boxes[0, 0]) * 0.5  # 小框宽度的一半

            # 以全部小框的左上角这个点去拟合一条直线,然后计算一下文本行x坐标的极左极右对应的y坐标
            lt_y, rt_y = self.fit_y(text_line_boxes[:, 0], text_line_boxes[:, 1], x0 + offset, x1 - offset)
            # 以全部小框的左下角这个点去拟合一条直线,然后计算一下文本行x坐标的极左极右对应的y坐标
            lb_y, rb_y = self.fit_y(text_line_boxes[:, 0], text_line_boxes[:, 3], x0 + offset, x1 - offset)

            score = scores[list(tp_indices)].sum() / float(len(tp_indices))  # 求全部小框得分的均值作为文本行的均值

            text_lines[index, 0] = x0
            text_lines[index, 1] = min(lt_y, rt_y)  # 文本行上端 线段 的y坐标的小值
            text_lines[index, 2] = x1
            text_lines[index, 3] = max(lb_y, rb_y)  # 文本行下端 线段 的y坐标的大值
            text_lines[index, 4] = score  # 文本行得分
            text_lines[index, 5] = z1[0]  # 根据中心点拟合的直线的k,b
            text_lines[index, 6] = z1[1]
            height = np.mean((text_line_boxes[:, 3] - text_line_boxes[:, 1]))  # 小框平均高度
            text_lines[index, 7] = height + 2.5

        text_recs = np.zeros((len(text_lines), 9), np.float)
        index = 0
        for line in text_lines:
            b1 = line[6] - line[7] / 2  # 根据高度和文本行中心线,求取文本行上下两条线的b值
            b2 = line[6] + line[7] / 2
            x1 = line[0]
            y1 = line[5] * line[0] + b1  # 左上
            x2 = line[2]
            y2 = line[5] * line[2] + b1  # 右上
            x3 = line[0]
            y3 = line[5] * line[0] + b2  # 左下
            x4 = line[2]
            y4 = line[5] * line[2] + b2  # 右下
            disX = x2 - x1
            disY = y2 - y1
            width = np.sqrt(disX * disX + disY * disY)  # 文本行宽度

            fTmp0 = y3 - y1  # 文本行高度
            fTmp1 = fTmp0 * disY / width
            x = np.fabs(fTmp1 * disX / width)  # 做补偿
            y = np.fabs(fTmp1 * disY / width)
            if line[5] < 0:
                x1 -= x
                y1 += y
                x4 += x
                y4 -= y
            else:
                x2 += x
                y2 += y
                x3 -= x
                y3 -= y
            text_recs[index, 0] = x1
            text_recs[index, 1] = y1
            text_recs[index, 2] = x2
            text_recs[index, 3] = y2
            text_recs[index, 4] = x3
            text_recs[index, 5] = y3
            text_recs[index, 6] = x4
            text_recs[index, 7] = y4
            text_recs[index, 8] = line[4]
            index = index + 1

        return text_recs
四、CTPN网络的训练部分
1、将真实框转化为预测结果的形式
数据集我们选择的是ICDAR2015文本数据集,其中包含1000张文本图片以及对应的txt标签文件,其中标签文件包含文本左上、右上、左下和右下4个坐标点,以及对应的label标签值。
img:
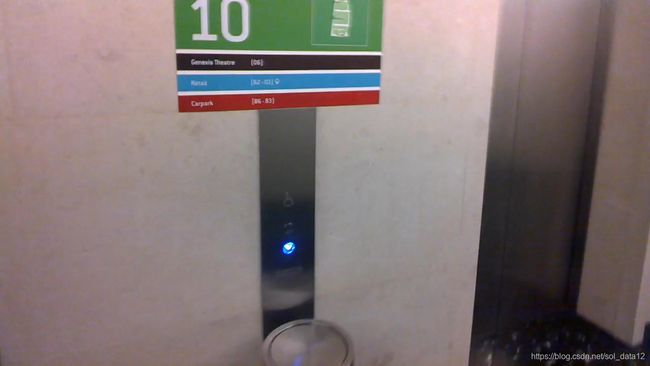
label:
377,117,463,117,465,130,378,130,Genaxis Theatre
493,115,519,115,519,131,493,131,[06]
374,155,409,155,409,170,374,170,###
492,151,551,151,551,170,492,170,62-03
376,198,422,198,422,212,376,212,Carpark
494,190,539,189,539,205,494,206,###
374,1,494,0,492,85,372,86,###
将图片img输入进入CTPN网络,得到y、h和x偏移量的预测结果,但是我们图片的真实信息,即真实框是上述坐标的形式,因此我们需要将上述的真实框进行转化,转化成预测结果应该的形式,只有当真实结果和预测结果形式一样,我们才能进行loss的计算,进行网络的反向传播,进行网络权重参数的更新。
我们将真实框转化成预测结果的形式称之为编码,将先验框转换成预测框称之为解码。
正负样本的选择:我们将计算真实框与图片中所有先验框IOU的值,将IOU>0.7作为正样本,IOU<0.3作为负样本,IOU在0.3-0.7之间的样本作为忽略的样本。
# 真实框的编码过程
def bbox_transfrom(anchors, gtboxes):
    """
     compute relative predicted vertical coordinates Vc ,Vh
        with respect to the bounding box location of an anchor
    """
    regr = np.zeros((anchors.shape[0], 2))
    # 获得真实框的中心点y的坐标
    Cy = (gtboxes[:, 1] + gtboxes[:, 3]) * 0.5
    # 获得中心点x轴的坐标
    Cx = (gtboxes[:, 0] + gtboxes[:, 2]) * 0.5

    # 获得先验框中心点y的坐标
    Cya = (anchors[:, 1] + anchors[:, 3]) * 0.5
    # 获得先验框中心点x的坐标
    Cxa = (anchors[:, 0] + anchors[:, 2]) * 0.5

    # 或者真实框的高度
    h = gtboxes[:, 3] - gtboxes[:, 1] + 1.0
    # 或者先验框的高度
    ha = anchors[:, 3] - anchors[:, 1] + 1.0
    # 或者先验框的宽度
    wa = 16

    Vc = (Cy - Cya) / ha
    Vh = np.log(h / ha)
    Vo = (Cx-Cxa) / wa

    return np.vstack((Vc, Vh, Vo)).transpose()


def cal_rpn(imgsize, featuresize, scale, gtboxes):
    imgh, imgw = imgsize
    # 生成56x100x10个候选框,并转化为左上角和右下角x1,y1,x2,y2的形式
    # (56000,4)
    base_anchor = gen_anchor(featuresize, scale)
    #print(base_anchor.shape)
    # (56000,gt)
    overlaps = cal_overlaps(base_anchor, gtboxes)
    #print(overlaps.shape)
    # 创建一个空的labels,(56000,)
    # 正样本设为1,负样本为0,其他的为-1
    labels = np.empty(overlaps.shape[0])
    labels.fill(-1)
    # 找到每一个真实框对应的iou最大的候选框
    # 比如(10001,300,434,323,404,29458,2002,...,)  (gt,)
    gt_argmax_overlaps = overlaps.argmax(axis=0)
    # 找到每一个候选框对应的iou最大的真实框
    # (56000,)  比如(10,21,4,5,2,...,)
    anchor_argmax_overlaps = overlaps.argmax(axis=1)
    # 取出每个先验框对应的iou最大的真实框的iou值(56000,)
    anchor_max_overlaps = overlaps[range(overlaps.shape[0]), anchor_argmax_overlaps]
    # IOU > IOU_POSITIVE
    labels[anchor_max_overlaps > IOU_POSITIVE] = 1
    # IOU
    labels[anchor_max_overlaps < IOU_NEGATIVE] = 0
    # ensure that every GT box has at least one positive RPN region
    labels[gt_argmax_overlaps] = 1
    # only keep anchors inside the image
    outside_anchor = np.where(
        (base_anchor[:, 0] < 0) |
        (base_anchor[:, 1] < 0) |
        (base_anchor[:, 2] >= imgw) |
        (base_anchor[:, 3] >= imgh)
    )[0]
    # 将超出图片区域的先验框对应的标签设置为-1,需要忽略
    labels[outside_anchor] = -1
    # subsample positive labels ,if greater than RPN_POSITIVE_NUM(default 128)
    fg_index = np.where(labels == 1)[0]
    # print(len(fg_index))
    # 正样本的数量为150个,如果超过150个,将超出的设置为-1
    if (len(fg_index) > RPN_POSITIVE_NUM):
        labels[np.random.choice(fg_index, len(fg_index) - RPN_POSITIVE_NUM, replace=False)] = -1

    # subsample negative labels
    if not OHEM:
        bg_index = np.where(labels == 0)[0]
        num_bg = RPN_TOTAL_NUM - np.sum(labels == 1)
        if (len(bg_index) > num_bg):
            # print('bgindex:',len(bg_index),'num_bg',num_bg)
            labels[np.random.choice(bg_index, len(bg_index) - num_bg, replace=False)] = -1

    # calculate bbox targets
    # debug here
    # 编码过程,获得y和h的偏移量
    bbox_targets = bbox_transfrom(base_anchor, gtboxes[anchor_argmax_overlaps, :])
    # bbox_targets=[]
    # print(len(labels),len(bbox_targets),len(base_anchor),base_anchor[0],labels[0])

    return [labels, bbox_targets], base_anchor
2、利用上述处理的真实框,与预测结果进行loss函数的计算
loss的计算分为三个部分:

1、Lcls用于区分文本与非文本的分类损失,分类损失使用的是softmax分类损失;
2、Lrev即中心点y坐标和高度h的回归loss,采用的是smooth L1 loss
3、Lreo即文本框左侧或右侧x坐标的回归loss,采用的是smooth L1 loss
在训练过程中,正负样本是极不不平衡的,一张图片中正样本可能就那几个,而负样本可能是成百上千,这样会导致计算的loss很大,因此为了解决正负样本不平衡的问题,引入了困难样本挖掘,即将正负样本的数量控制在1:3。
实现代码如下:
class RPN_REGR_Loss(nn.Module):
    def __init__(self, device, sigma=9.0):
        super(RPN_REGR_Loss, self).__init__()
        self.sigma = sigma
        self.device = device

    def forward(self, input, target):
        '''
        smooth L1 loss
        :param input:y_preds
        :param target: y_true
        :return:
        '''
        try:
            cls = target[0, :, 0]
            regr = target[0, :, 1:3]
            # apply regression to positive sample
            regr_keep = (cls == 1).nonzero()[:, 0]
            regr_true = regr[regr_keep]
            regr_pred = input[0][regr_keep]
            diff = torch.abs(regr_true - regr_pred)
            less_one = (diff<1.0/self.sigma).float()
            loss = less_one * 0.5 * diff ** 2 * self.sigma + torch.abs(1- less_one) * (diff - 0.5/self.sigma)
            loss = torch.sum(loss, 1)
            loss = torch.mean(loss) if loss.numel() > 0 else torch.tensor(0.0)
        except Exception as e:
            print('RPN_REGR_Loss Exception:', e)
            # print(input, target)
            loss = torch.tensor(0.0)

        return loss.to(self.device)


class RPN_REFI_Loss(nn.Module):
    def __init__(self, device, sigma=9.0):
        super(RPN_REFI_Loss, self).__init__()
        self.sigma = sigma
        self.device = device

    def forward(self, input, target):
        '''
        smooth L1 loss
        :param input:y_preds
        :param target: y_true
        :return:
        '''
        try:
            cls = target[0, :, 0]
            refi = target[0, :, 3]
            # apply regression to positive sample
            regr_keep = (cls == 1).nonzero()[:, 0]
            regr_true = refi[regr_keep]
            regr_pred = input[0][regr_keep]
            diff = torch.abs(regr_true - regr_pred)
            less_one = (diff<1.0/self.sigma).float()
            loss = less_one * 0.5 * diff ** 2 * self.sigma + torch.abs(1- less_one) * (diff - 0.5/self.sigma)
            loss = torch.sum(loss, 1)
            loss = torch.mean(loss) if loss.numel() > 0 else torch.tensor(0.0)
        except Exception as e:
            print('RPN_REGR_Loss Exception:', e)
            # print(input, target)
            loss = torch.tensor(0.0)

        return loss.to(self.device)


class RPN_CLS_Loss(nn.Module):
    def __init__(self,device):
        super(RPN_CLS_Loss, self).__init__()
        self.device = device

    def forward(self, input, target):
        y_true = target[0][0]
        cls_keep = (y_true != -1).nonzero()[:, 0]
        cls_true = y_true[cls_keep].long()
        cls_pred = input[0][cls_keep]
        loss = F.nll_loss(F.log_softmax(cls_pred, dim=-1), cls_true)  # original is sparse_softmax_cross_entropy_with_logits
        # loss = nn.BCEWithLogitsLoss()(cls_pred[:,0], cls_true.float())  # 18-12-8
        loss = torch.clamp(torch.mean(loss), 0, 10) if loss.numel() > 0 else torch.tensor(0.0)
        return loss.to(self.device)
3、训练细节
对于主干网络VGG16,采用了ImageNet上与训练好的权重值,而对于后面的层,包括LSTM层和Head层,则是使用均值为0,标准差为0.001的高斯分布来进行随机初始化。优化器的选择,使用动量为0.9和0.0005的权重衰减的随机梯度下降优化器,在前16k次迭代中,学习率设置为0.001,在后4k次迭代中中,学习率设置为0.0001。
4、CTPN模型的文件摆放

文本使用的数据为ICDAR2015文本数据集,数据集放在了train_data文件下,其中train_img包含了训练所需要的图片,train_label为对应的标签文件。
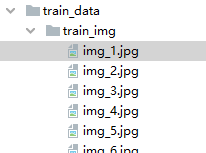
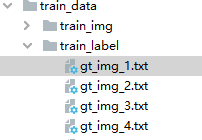
运行ctpn_train.py,即可训练模型的训练,大家可以修改该py文件中的batch_size大小,以及对应的学习率的大小。
注:笔者也是一名AI的新手,学习AI之路全是根据这个大佬的博客进行学习的,https://blog.csdn.net/weixin_44791964。