Pytorch深度学习(二):反馈神经网络(BPNN)
Pytorch深度学习(二):反馈神经网络(BPNN)
- 参考B站课程:《PyTorch深度学习实践》完结合集
- 传送门:《PyTorch深度学习实践》完结合集
本文浅学反馈神经网络(Back Propagation Neural Network)
一、反向传播(Back Propagation)
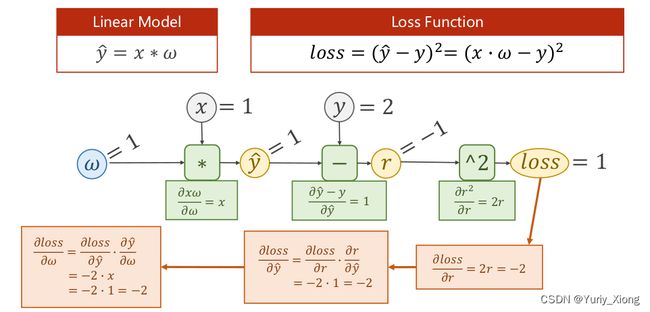
仍然以上文的线性模型为例子,其第一次“学习”过程如下:
其中,反向传播过程求出了误差 l o s s loss loss 关于各个变量的偏导数值,最后用于更新权重 w w w ,而这一过程,我们利用torch中的函数来实现。关键代码:l.backward()
相关预备知识:
- 什么是张量
- torch.Tensor的数据类型
- w.grad.data的数据类型
- w.grad.data.item()的数据类型
- …
读者自行了解或利用type()等进行程序实验
程序如下:
import torch
import numpy as np
from matplotlib import pyplot as plt

xdata = [1, 2, 3]
ydata = [2, 4, 6]

w = torch.Tensor([1])
w.requires_grad = True  # the default is False which will don't compute grad


costlist = []


def forward(x):
    return x * w

def loss(x, y):
    ypred = forward(x)
    return (ypred - y) ** 2


print('predict (before training)', 4, forward(4).item())

for epoch in range(100):
    cost = 0
    for x, y in zip(xdata, ydata):
        l = loss(x, y)
        l.backward()    # compute w.grad = \frac{\partial l}{\partial w}
        cost += l.item()
        print('\t grad:', x, y, w.grad.item())
        w.data = w.data - 0.01 * w.grad.data

        w.grad.data.zero_()
    costlist.append(cost/len(xdata))
    print('progress:', epoch, l.item())

print('predict (after training)', 4, forward(4).item())

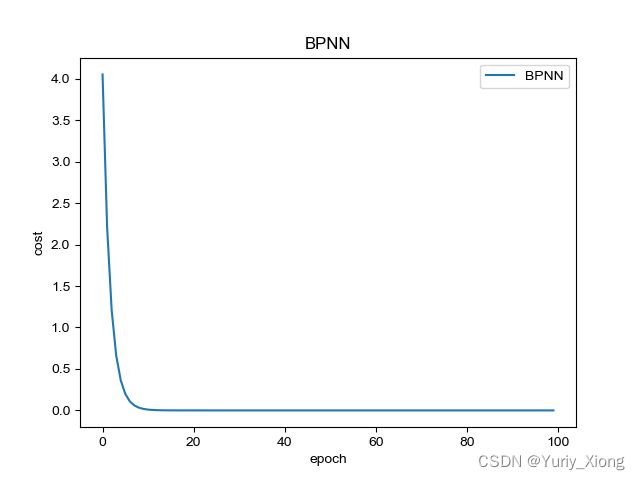
plt.plot(range(100), costlist, label='BPNN')
plt.xlabel('epoch')
plt.ylabel('cost')
plt.title('BPNN')
plt.legend()
plt.show()
二、练习
将线性模型改为以下一元二次多项式的模型,同样通过BPNN求出相关的参数 w 1 , w 2 , b w_1,w_2,b w1,w2,b ,并且预测 x = 4 x=4 x=4 时 y y y 的值

import torch
import numpy as np
from matplotlib import pyplot as plt

xdata = [1, 2, 3]
ydata = [2, 4, 6]

w1 = torch.Tensor([1])
w1.requires_grad = True  # the default is False which will don't compute grad

w2 = torch.Tensor([1])
w2.requires_grad = True  # the default is False which will don't compute grad

b = torch.Tensor([1])
b.requires_grad = True  # the default is False which will don't compute grad

costlist = []

def forward(x):
    return w1 * x**2 + w2 * x + b

def loss(x, y):
    ypred = forward(x)
    return (ypred - y) ** 2


print('predict (before training):', 4, forward(4).item())

for epoch in range(100):
    cost = 0
    for x, y in zip(xdata, ydata):
        l = loss(x, y)
        l.backward()    # compute w.grad = \frac{\partial l}{\partial w}
        cost += l.item()
        print('\t grad:', x, y, w1.grad.item(), w2.grad.item(), b.grad.item())
        w1.data = w1.data - 0.01 * w1.grad.data
        w2.data = w2.data - 0.01 * w2.grad.data
        b.data = b.data - 0.01 * b.grad.data
        w1.grad.data.zero_()
        w2.grad.data.zero_()
        b.grad.data.zero_()
    costlist.append(cost/len(xdata))
    print('progress:', epoch, l.item())

print('predict (after training):', 4, forward(4).item())
print('parameter:w1 = {}, w2 = {}, b = {}'.format(w1.item(), w2.item(), b.item()))

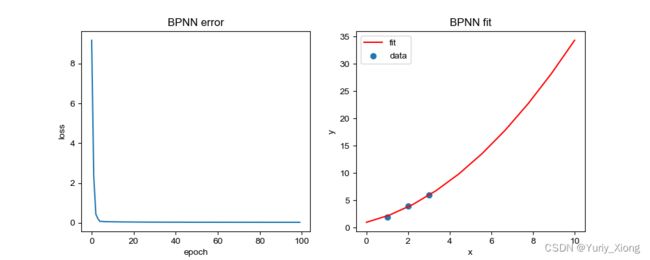
plt.figure(figsize=(10,4))
plt.subplot(1,2,1)
plt.plot(range(100), costlist)
plt.xlabel('epoch')
plt.ylabel('loss')

plt.title('BPNN error')

plt.subplot(1, 2, 2)
xx = np.linspace(0, 10, 10)
yy = w1.item()* xx**2 + w2.item()*xx +b.item()
plt.plot(xx, yy, color='red', label='fit')
plt.scatter(xdata, ydata, label='data')
plt.legend()
plt.title('BPNN fit')
plt.xlabel('x')
plt.ylabel('y')
plt.show()
progress: 99 0.00631808303296566
predict (after training): 4 8.544171333312988
parameter:w1 = 0.24038191139698029, w2 = 0.9266766309738159, b = 0.99135422706604


