排序数据图-R/python
数据排序的主要表现形式如下所示:
- 条形图
- 棒棒糖图
- 点图
- 坡度图
- 哑铃图
数据前准备
- R
library(tidyverse)

## 全局主题设置
options(scipen=999)  # 关掉像 1e+48 这样的科学符号
# 颜色设置(灰色系列)
cbp1 <- c("#999999", "#E69F00", "#56B4E9", "#009E73",
          "#F0E442", "#0072B2", "#D55E00", "#CC79A7")

# 颜色设置(黑色系列)
cbp2 <- c("#000000", "#E69F00", "#56B4E9", "#009E73",
          "#F0E442", "#0072B2", "#D55E00", "#CC79A7")


ggplot <- function(...) ggplot2::ggplot(...) +
  scale_color_manual(values = cbp1) +
  scale_fill_manual(values = cbp1) + # 注意: 使用连续色阶时需要重写
  theme_bw()
- python
import numpy as np
import pandas as pd
import matplotlib as mpl
import matplotlib.pyplot as plt
import seaborn as sns
import warnings
#warnings.filterwarnings(action='once')

# 主题设置
plt.style.use('seaborn-whitegrid')
sns.set_style("whitegrid")
#print(mpl.__version__)# 3.5.1
#print(sns.__version__)# 0.12.0
条形图
- R
data(mpg)
cty_mpg <- aggregate(mpg$cty, by=list(mpg$manufacturer), FUN=mean)  # aggregate
colnames(cty_mpg) <- c("make", "mileage")  # change column names
cty_mpg <- cty_mpg[order(cty_mpg$mileage), ]  # sort
cty_mpg$make <- factor(cty_mpg$make, levels = cty_mpg$make)  # to retain the order in plot.

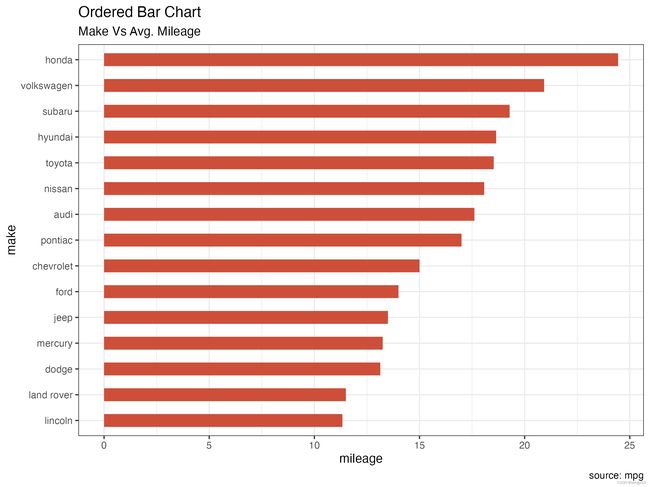
## 排序条形图
ggplot(cty_mpg, aes(x=make, y=mileage)) +
  geom_bar(stat="identity", width=.5, fill="tomato3") +
  labs(title="Ordered Bar Chart",
       subtitle="Make Vs Avg. Mileage",
       caption="source: mpg") +
  coord_flip()
- python-matplotlib
# Prepare Data
mpg = pd.read_csv("./data/mpg_ggplot.csv")
df = mpg[['cty',
             'manufacturer']].groupby('manufacturer').apply(lambda x: x.mean())
df.sort_values('cty', inplace=True)
df.reset_index(inplace=True)


fig, ax = plt.subplots(figsize=(10, 8), facecolor='white', dpi=80)
ax.hlines(y=df.index,
          xmin=0,
          xmax=df.cty,
          color='#dc2624',
          alpha=0.7,
          linewidth=20)

# Annotate Text
for i, cty in enumerate(df.cty):
    ax.text(cty + 0.5,i, round(cty, 1), horizontalalignment='center')

# Title, Label, Ticks and Ylim
ax.set_title('Bar Chart for Highway Mileage', fontdict={'size': 12})
plt.yticks(df.index,
           df.manufacturer.str.upper(),
        #    rotation=60,
           horizontalalignment='right',
           fontsize=10)
plt.xticks(fontsize=12)
plt.ylabel('Ordered Bar Chart', fontsize=12)
plt.xlabel("mileage",fontsize=12)
plt.xlim = (0, 30)
plt.show()
- python-seaborn
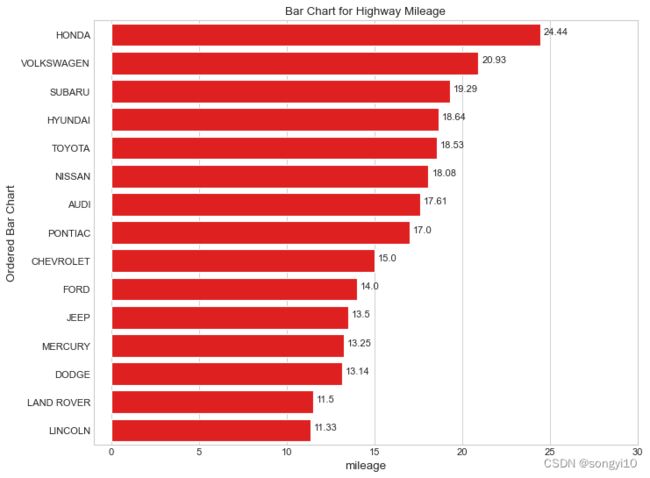
# Prepare Data
mpg = pd.read_csv("./data/mpg_ggplot.csv")
df = mpg[['cty',
             'manufacturer']].groupby('manufacturer').apply(lambda x: x.mean())
df.sort_values('cty', inplace=True,ascending=False)


fig= plt.subplots(figsize=(10, 8), facecolor='white', dpi=80)
g = sns.barplot(x=df.cty,y=df.index,color="red")
g.set_xlim(-1,30)
for i,n in enumerate(df.cty):
    g.text(n+0.2,i,round(n,2))
g.set_yticklabels(df.index.str.upper())
g.set_ylabel('Ordered Bar Chart', fontsize=12)
g.set_xlabel("mileage",fontsize=12)
g.set_title('Bar Chart for Highway Mileage', fontdict={'size': 12})
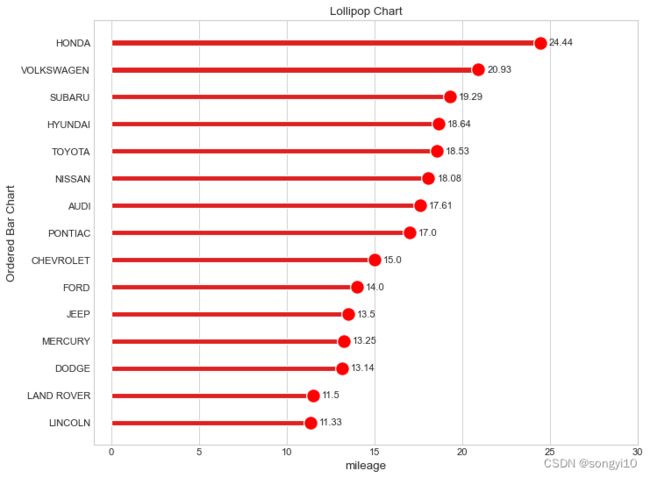
棒棒糖图
- R
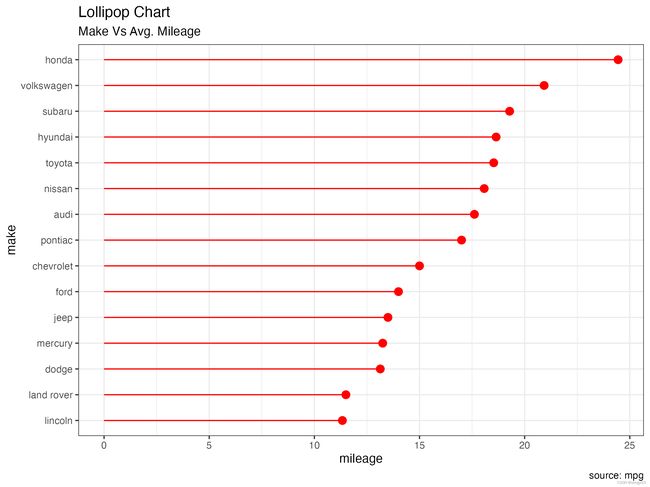
ggplot(cty_mpg, aes(x=make, y=mileage)) +
  geom_point(size=3,color="red") +
  geom_segment(aes(x=make,
                   xend=make,
                   y=0,
                   yend=mileage),color="red") +
  labs(title="Lollipop Chart",
       subtitle="Make Vs Avg. Mileage",
       caption="source: mpg") +
  coord_flip()
- python-matplotlib
# Prepare Data
df_raw = pd.read_csv("./data/mpg_ggplot.csv")
df = df_raw[['cty',
             'manufacturer']].groupby('manufacturer').apply(lambda x: x.mean())
df.sort_values('cty', inplace=True)
df.reset_index(inplace=True)

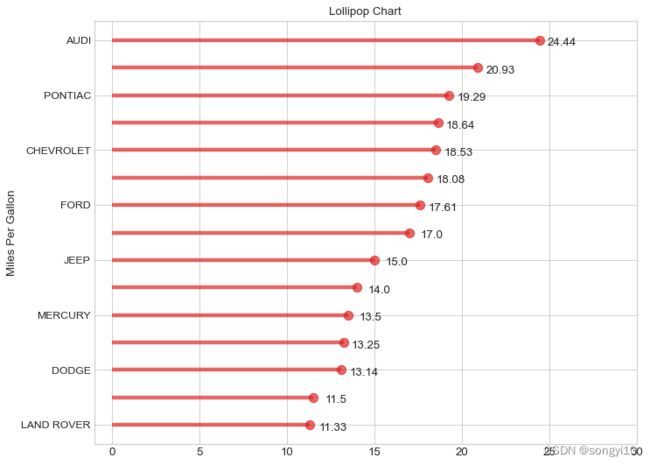
# Draw plot
fig, ax = plt.subplots(figsize=(10, 8), dpi=80)
ax.hlines(y=df.index,
          xmin=0,
          xmax=df.cty,
          color='#dc2624',
          alpha=0.7,
          linewidth=4)
ax.scatter(y=df.index, x=df.cty, s=85, color='#dc2624', alpha=0.7)

# Title, Label, Ticks and Ylim
ax.set_title('Lollipop Chart', fontdict={'size': 12})

plt.ylabel('Miles Per Gallon', fontsize=12)
# ax.set_xticks(df.index)
ax.set_yticklabels(df.manufacturer.str.upper(),
                #    rotation=60,
                   fontdict={
                       'horizontalalignment': 'right',
                       'size': 11
                   })
ax.set_xlim(-1, 30)
plt.xticks(fontsize=12)

# Annotate
for row in df.itertuples():
    ax.text(row.cty+1.3,
            row.Index-.3,
            s=round(row.cty, 2),
            horizontalalignment='center',
            verticalalignment='bottom',
            fontsize=12)

plt.show()
- python-seaborn
# Prepare Data
df_raw = pd.read_csv("./data/mpg_ggplot.csv")
df = df_raw[['cty',
             'manufacturer']].groupby('manufacturer').apply(lambda x: x.mean())
df.sort_values('cty', inplace=True,ascending=False)


# Draw plot
fig = plt.subplots(figsize=(10, 8), dpi=80)
sns.barplot(x=df.cty,y=df.index,color="red",width=.2)
g = sns.scatterplot(x=df.cty,y=df.index,color="red",s=200)

for i,n in enumerate(df.cty):
    g.text(n+0.5,i+.1,round(n,2))


g.set_xlim(-1,30)
g.set_yticklabels(df.index.str.upper())
g.set_ylabel('Ordered Bar Chart', fontsize=12)
g.set_xlabel("mileage",fontsize=12)
g.set_title('Lollipop Chart', fontdict={'size': 12})
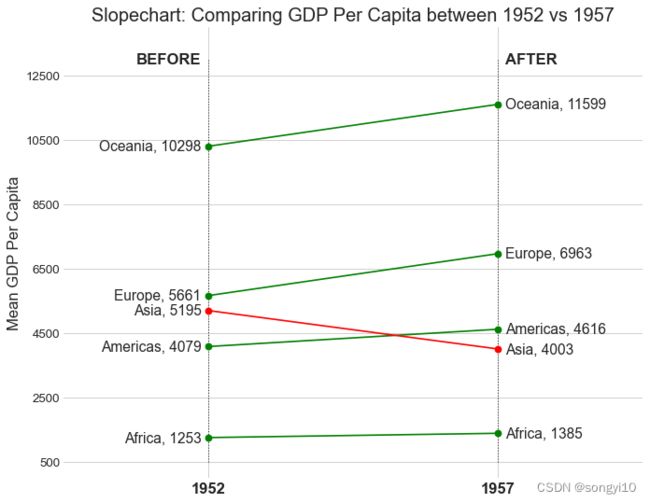
坡度图
- R
library(scales)
# 数据准备
df <- read.csv("https://raw.githubusercontent.com/selva86/datasets/master/gdppercap.csv")
colnames(df) <- c("continent", "1952", "1957")
left_label <- paste(df$continent, round(df$'1952'),sep=", ")
right_label <- paste(df$continent, round(df$'1957'),sep=", ")
df$class <- ifelse((df$'1957' - df$'1952') < 0, "red", "green")


## 坡度图
p <- ggplot(df) + geom_segment(aes(x=1, xend=2, y=`1952`, yend=`1957`, col=class), size=.75, show.legend=F) +
  geom_vline(xintercept=1, linetype="dashed", size=.1) +
  geom_vline(xintercept=2, linetype="dashed", size=.1) +
  scale_color_manual(labels = c("Up", "Down"),
                     values = c("green"="#00ba38", "red"="#f8766d")) +  # color of lines
  labs(x="", y="Mean GdpPerCap") +  # Axis labels
  xlim(.5, 2.5) + ylim(0,(1.1*(max(df$`1952`, df$`1957`))))  # X and Y axis limits

# Add texts
p <- p + geom_text(label=left_label, y=df$`1952`, x=rep(1, NROW(df)), hjust=1.1, size=3.5)
p <- p + geom_text(label=right_label, y=df$`1957`, x=rep(2, NROW(df)), hjust=-0.1, size=3.5)
p <- p + geom_text(label="BEFORE", x=1, y=1.1*(max(df$`1952`, df$`1957`)), hjust=1.2, size=5)  # title
p <- p + geom_text(label="AFTER", x=2, y=1.1*(max(df$`1952`, df$`1957`)), hjust=-0.1, size=5)  # title


#设置主题
p + theme(panel.background = element_blank(),
          panel.grid = element_blank(),
          axis.ticks = element_blank(),
          axis.text.x = element_blank(),
          panel.border = element_blank(),
          plot.margin = unit(c(1,2,1,2), "cm"))
- python-matplotlib
import matplotlib.lines as mlines
# Import Data
df = pd.read_csv("./data/gdppercap.csv")

left_label = [
    str(c) + ', ' + str(round(y)) for c, y in zip(df.continent, df['1952'])
]
right_label = [
    str(c) + ', ' + str(round(y)) for c, y in zip(df.continent, df['1957'])
]
klass = [
    'red' if (y1 - y2) < 0 else 'green'
    for y1, y2 in zip(df['1952'], df['1957'])
]


# draw line
# https://stackoverflow.com/questions/36470343/how-to-draw-a-line-with-matplotlib/36479941
def newline(p1, p2, color='black'):
    ax = plt.gca()
    l = mlines.Line2D([p1[0], p2[0]], [p1[1], p2[1]],
                      color='red' if p1[1] - p2[1] > 0 else 'green',
                      marker='o',
                      markersize=6)
    ax.add_line(l)
    return l


fig, ax = plt.subplots(1, 1, figsize=(10, 8), dpi=80)

# Vertical Lines
ax.vlines(x=1,
          ymin=500,
          ymax=13000,
          color='black',
          alpha=0.7,
          linewidth=1,
          linestyles='dotted')
ax.vlines(x=3,
          ymin=500,
          ymax=13000,
          color='black',
          alpha=0.7,
          linewidth=1,
          linestyles='dotted')

# Points
ax.scatter(y=df['1952'],
           x=np.repeat(1, df.shape[0]),
           s=10,
           color='black',
           alpha=0.7)
ax.scatter(y=df['1957'],
           x=np.repeat(3, df.shape[0]),
           s=10,
           color='black',
           alpha=0.7)

# Line Segmentsand Annotation
for p1, p2, c in zip(df['1952'], df['1957'], df['continent']):
    newline([1, p1], [3, p2])
    ax.text(1 - 0.05,
            p1,
            c + ', ' + str(round(p1)),
            horizontalalignment='right',
            verticalalignment='center',
            fontdict={'size': 14})
    ax.text(3 + 0.05,
            p2,
            c + ', ' + str(round(p2)),
            horizontalalignment='left',
            verticalalignment='center',
            fontdict={'size': 14})

# 'Before' and 'After' Annotations
ax.text(1 - 0.05,
        13000,
        'BEFORE',
        horizontalalignment='right',
        verticalalignment='center',
        fontdict={
            'size': 15,
            'weight': 700
        })
ax.text(3 + 0.05,
        13000,
        'AFTER',
        horizontalalignment='left',
        verticalalignment='center',
        fontdict={
            'size': 15,
            'weight': 700
        })

# Decoration
ax.set_title("Slopechart: Comparing GDP Per Capita between 1952 vs 1957",
             fontdict={'size': 18})
ax.set(xlim=(0, 4), ylim=(0, 14000), ylabel='Mean GDP Per Capita')
plt.ylabel('Mean GDP Per Capita', fontsize=15)
ax.set_xticks([1, 3])
ax.set_xticklabels(["1952", "1957"], fontdict={'size': 15, 'weight': 700})
plt.yticks(np.arange(500, 13000, 2000), fontsize=12)

# Lighten borders
plt.gca().spines["top"].set_alpha(.0)
plt.gca().spines["bottom"].set_alpha(.0)
plt.gca().spines["right"].set_alpha(.0)
plt.gca().spines["left"].set_alpha(.0)
plt.show()
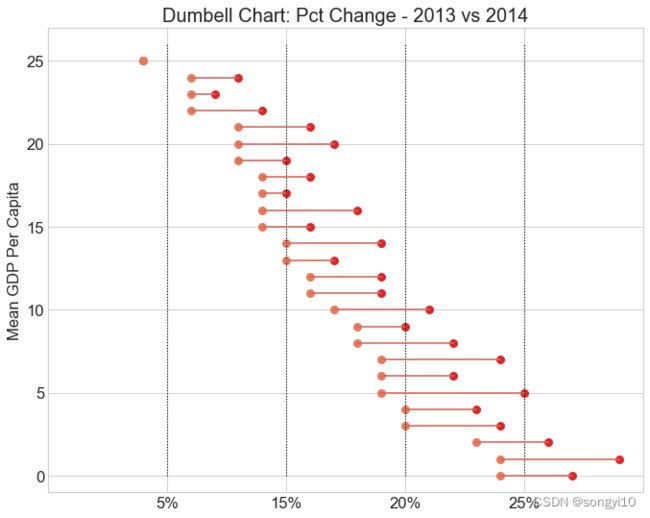
哑铃图
- R
library(ggalt)
health <- read.csv("https://raw.githubusercontent.com/selva86/datasets/master/health.csv")
health$Area <- factor(health$Area, levels=as.character(health$Area))  # for right ordering of the dumbells
percent <- c("0%","5%","10%","15%","20%","25%")

gg <- ggplot(health, aes(x=pct_2013, xend=pct_2014, y=Area, group=Area)) +
  geom_dumbbell(color="#a3c4dc",
                size=0.75,
                point.colour.l="#0e668b") +
  scale_x_continuous(label=percent) +
  labs(x=NULL,
       y=NULL,
       title="Dumbbell Chart",
       subtitle="Pct Change: 2013 vs 2014") +
  theme(plot.title = element_text(hjust=0.5, face="bold"),
        plot.background=element_rect(fill="#f7f7f7"),
        panel.background=element_rect(fill="#f7f7f7"),
        panel.grid.minor=element_blank(),
        panel.grid.major.y=element_blank(),
        panel.grid.major.x=element_line(),
        axis.ticks=element_blank(),
        legend.position="top",
        panel.border=element_blank(),
        plot.margin = unit(rep(1, 4),'lines'))
plot(gg)
- python-matplotlib
import matplotlib.lines as mlines

# Import Data
df = pd.read_csv("https://raw.githubusercontent.com/selva86/datasets/master/health.csv")
df.sort_values('pct_2014', inplace=True)
df.reset_index(inplace=True)


# Func to draw line segment
def newline(p1, p2, color='black'):
    ax = plt.gca()
    l = mlines.Line2D([p1[0], p2[0]], [p1[1], p2[1]], color='#d5695d')
    ax.add_line(l)
    return l


# Figure and Axes
fig, ax = plt.subplots(1, 1, figsize=(10, 8), dpi=80)

# Vertical Lines
ax.vlines(x=.05,
          ymin=0,
          ymax=26,
          color='black',
          alpha=1,
          linewidth=1,
          linestyles='dotted')
ax.vlines(x=.10,
          ymin=0,
          ymax=26,
          color='black',
          alpha=1,
          linewidth=1,
          linestyles='dotted')
ax.vlines(x=.15,
          ymin=0,
          ymax=26,
          color='black',
          alpha=1,
          linewidth=1,
          linestyles='dotted')
ax.vlines(x=.20,
          ymin=0,
          ymax=26,
          color='black',
          alpha=1,
          linewidth=1,
          linestyles='dotted')

# Points
ax.scatter(y=df['index'], x=df['pct_2013'], s=50, color='#dc2624')
ax.scatter(y=df['index'], x=df['pct_2014'], s=50, color='#e87a59')

# Line Segments
for i, p1, p2 in zip(df['index'], df['pct_2013'], df['pct_2014']):
    newline([p1, i], [p2, i])

# Decoration
#ax.set_facecolor('#f8f2e4')
ax.set_title("Dumbell Chart: Pct Change - 2013 vs 2014", fontdict={'size': 18})
ax.set(xlim=(0, .25), ylim=(-1, 27), ylabel='Mean GDP Per Capita')
plt.ylabel('Mean GDP Per Capita', fontsize=15)
plt.yticks(fontsize=15)
ax.set_xticks([.05, .1, .15, .20])
ax.set_xticklabels(['5%', '15%', '20%', '25%'], fontdict={'size': 15})
plt.show()
参考资料
R绘图:https://mp.weixin.qq.com/s?__biz=MzI1NjUwMjQxMQ==&mid=2247511805&idx=1&sn=1d9b0505bee6c9c90eb3b1a89dd4bd42&chksm=ea275119dd50d80f6caf017f8fc68ba156b835e2aea2de91c3abd8b45f4f77b905d1f79ab07d&scene=178&cur_album_id=2523928956895543301#rd
python绘图:https://mp.weixin.qq.com/s/DY_K1CisYElFL7Tt0Si6hw
