机器学习:支持向量机SVM的SVC和SVR
支持向量机SVM
- SVM的工作原理及分类
-
- 支持向量机的原理
- 线性可分的SVM
- 非线性可分的支持向量机
- 支持向量机分类SVC
- 支持向量机回归SVR
-
- SVR原理
- SVR模型
- 时间序列曲线预测
SVM的工作原理及分类
支持向量机的原理
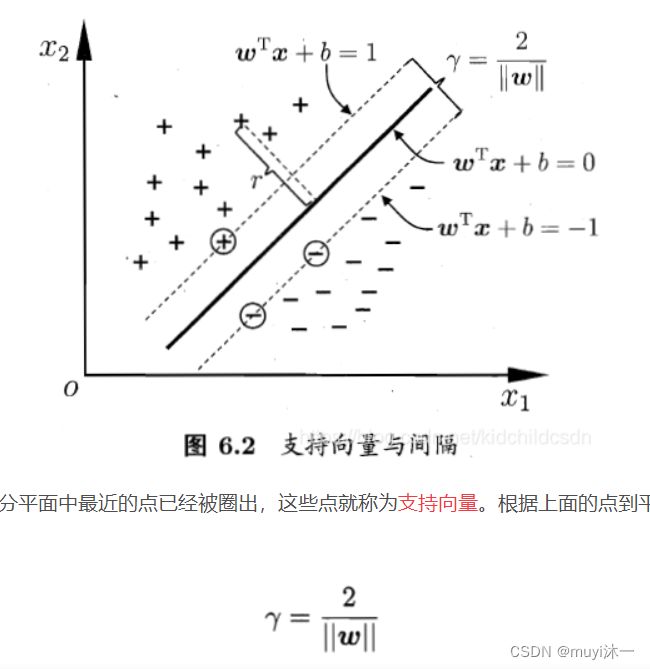
支持向量机(Support Vector Machine,SVM)是一种二类分类器,只支持两种类别的分类,不过在一些场合下可以将多个SVM串联起来,达到多分类的目的。其基本模型定义为特征空间上间隔最大的线性分类器,学习策略就是使间隔最大化,最终可转化为一个凸二次规划问题的求解。
简单来说,就是寻找一个分界超平面(如果数据是二维的,则是线;如果数据是三位的,则是平面;如果是三维以上,则是超平面),对于超平面的公式
![]()
传统的方式是使用最小二乘错误法,利用平方和值趋于最小寻找最优超平面,SVM算法的思路与传统的最小二乘法的思路不同,它所定义的分界面有两个特点:
第一,它夹在两类样本点之间;第二,两类样本点中所有“离它最近的点”都尽可能的远。
支持向量:就是离最优分类平面最近的离散点
线性可分的SVM
为什么考虑讲个最大?
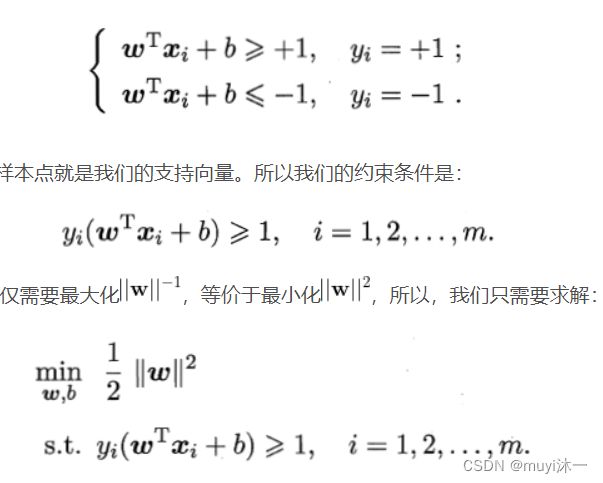
一个点距离分离超平面的远近可以表示分类预测的确信度,近的确信度高,所以SVM的目标是寻找一个超平面,使得离超平面较近的异类点之间能有更大的间隔,即不必考虑所有的样本点,只需让球的的超平面使得离它最近的点间隔最大。
非线性可分的支持向量机
线性不可分意味着某些样本点不能满足间隔大于1的条件 引入一个松弛变量![]()
使得间隔加上松弛变量大于等于,


其中,C>0为惩罚参数,C值大时对误分类的惩罚增大,C值小时对二误分类的惩罚减小
凸二次规划问题
支持向量机分类SVC
在https://scikit-learn.org/stable/modules/svm.html 网站上学习到的
'''
https://scikit-learn.org/stable/modules/svm.html
'''
import numpy as np
import matplotlib.pyplot as plt
from sklearn import svm, datasets


def make_meshgrid(x, y, h=.02):
#创建要在其中打印的点网格
    x_min, x_max = x.min() - 1, x.max() + 1
    y_min, y_max = y.min() - 1, y.max() + 1
    #np.arange(start,end,step)
    #X, Y = np.meshgrid(x, y) 代表的是将x中每一个数据和y中每一个数据组合生成很多点,
    #然后将这些点的x坐标放入到X中,y坐标放入Y中,并且相应位置是对应的
    xx, yy = np.meshgrid(np.arange(x_min, x_max, h),
                         np.arange(y_min, y_max, h))
    return xx, yy

#**params,传递dictionary
#params、*params分别传递单参数、tuple
#相当于只是绘制了分区的背景板
def plot_contours(ax, clf, xx, yy, **params):
    #模型预测,np.c_按行连接两个矩阵,要求行数相等
    Z = clf.predict(np.c_[xx.ravel(), yy.ravel()])
    Z = Z.reshape(xx.shape)
    #contourf绘制二维颜色填充图
    #contour画的是等高线中的线,而contourf画的是登高线之间的区域
    out = ax.contourf(xx, yy, Z, **params) #Z和xx,yy维度相同
    return out

#导入数据
iris = datasets.load_iris()
#只获取前两个特征,绘制二维图像
X = iris.data[:, :2]
y = iris.target

#设置惩罚参数
C = 1.0
#定义多种模型
models = (svm.SVC(kernel='linear', C=C),
          svm.LinearSVC(C=C),
          svm.SVC(kernel='rbf', gamma=0.7, C=C),
          svm.SVC(kernel='poly', degree=3, C=C))
#循环拟合模型
models = (clf.fit(X, y) for clf in models)

titles = ('SVC with linear kernel',
          'LinearSVC (linear kernel)',
          'SVC with RBF kernel',
          'SVC with polynomial (degree 3) kernel')


plt.figure(1)
#设置3*2画布
fig, sub = plt.subplots(2, 2)
#设置子图之间的空间保留的宽度和高度
plt.subplots_adjust(wspace=0.4, hspace=0.4)

X0, X1 = X[:, 0], X[:, 1]
xx, yy = make_meshgrid(X0, X1)

#循环绘图
#sub.flatten()后只需要用0,1,2,3…记录位置,不使用此函数需要用坐标表示
for clf, title, ax in zip(models, titles, sub.flatten()):
    plot_contours(ax, clf, xx, yy,
                  cmap=plt.cm.coolwarm, alpha=0.8)
    #cmap指定点颜色,edgecolors指定点的边界颜色,'k'黑色边框
    ax.scatter(X0, X1, c=y, cmap=plt.cm.coolwarm, s=20, edgecolors='k')
    ax.set_xlim(xx.min(), xx.max())
    ax.set_ylim(yy.min(), yy.max())
    ax.set_xlabel('Sepal length')
    ax.set_ylabel('Sepal width')
    ax.set_xticks(())
    ax.set_yticks(())
    ax.set_title(title)
 plt.show()
支持向量机回归SVR
SVR是SVM的重要应用分支。SVR回归就是找到一个回归平面,让一个集合的所有数据到该平面的距离最近。
SVR原理
SVR是SVM的一种运用,基本的思路是一致,除了一些细微的区别。使用SVR作回归分析,与SVM一样需要找到一个超平面,不同的是:在SVM中要找出一个间隔最大的超平面,而在SVR中是定义一个ε
如5-7图所示,定义虚线内区域的数据点的残差为0,而虚线区域外的数据点(支持向量)到虚线的边界的距离为残差(ξ)与线性模型类似,希望这些残差(ξ) 最小(Minimize)。所以大致上来说,SVR就是要找出一个最佳的条状区域(2ε宽度),再对区域外的点进行回归。

对于非线性的模型,与SVM样使用核函数(kermel function)映射到特征空间,然后再进行回归。
SVR模型
构建SVR模型主要使用sklearn.svm包下的SVR()函数
import numpy as np
from sklearn.svm import SVR
import matplotlib.pyplot as plt

'''
生成样本数据,使用随机生成函数
'''
#np.random.rand(n,m)生成n行m列的服从“0~1”均匀分布的随机样本值
X = np.sort(5*np.random.rand(40,1),axis=0)  #axis=0按列排序
#获取X的sin值,ravel表示转换成行(无论多少行都变为一行)
y = np.sin(X).ravel()  # ravel()消除了组内的[]

'''
使用SVR()函数拟合回归模型
sklearn.svm.SVR(kernel ='rbf',degree = 3,gamma ='auto_deprecated',coef0 = 0.0,
                 tol = 0.001,C = 1.0)
kernel :指定要在算法中使用的内核类型
degree :多项式核函数的次数('poly')。被所有其他内核忽略
gamma :'rbf','poly'和'sigmoid'的核系数。隐含地决定了数据映射到新的特征空间后的分布,
        gamma越大,支持向量越少,gamma值越小,支持向量越多。
        支持向量的个数影响训练与预测的速度。
coef0 :核函数中的独立项。它只在'poly'和'sigmoid'中很重要。
tol : 容忍停止标准。
C :错误术语的惩罚参数C,默认1。

'''

#选用高斯核函数
svr_rbf = SVR(kernel = 'rbf',C = 1e3,gamma=0.1) #这里使用的1e3 = 1000.0
svr_rbf2 = SVR(kernel = 'rbf',C = 1e3,gamma=1.0)
svr_rbf3 = SVR(kernel = 'rbf',C = 1e3,gamma=10)
#选用线性核函数
svr_lin = SVR(kernel = 'linear',C = 1e3)
#选用多项式核函数
svr_poly = SVR(kernel = 'poly',C = 1e3,degree = 2)
#拟合回归模型
y_rbf = svr_rbf.fit(X,y).predict(X)

y_rbf2 = svr_rbf2.fit(X,y).predict(X)
y_rbf3 = svr_rbf3.fit(X,y).predict(X)

y_lin = svr_lin.fit(X,y).predict(X)
y_poly = svr_poly.fit(X,y).predict(X)

#绘制图像对比
plt.scatter(X, y, color='darkorange')

plt.plot(X, y_rbf, color='navy', lw=2, label='rbf 0.1')
plt.plot(X, y_rbf2, color='fuchsia', lw=2, label='rbf 1.0')
plt.plot(X, y_rbf3, color='red', lw=2, label='rbf 10')

plt.plot(X, y_lin, color='c', lw=2, label='linear')
plt.plot(X, y_poly, color='cornflowerblue', lw=2, label='poly')
plt.legend()
plt.show()
时间序列曲线预测
import numpy as np
from sklearn.svm import SVR
import matplotlib.pyplot as plt
from sklearn.metrics import mean_squared_error,mean_absolute_error
from sklearn.model_selection import GridSearchCV

'''
生成数据集
'''
N = 50
#设置随机数种子,保证每次产生的随机数相同
np.random.seed(0)
#随机产生[0,6)中的均匀分布序列并排序
#np.random.uniform(x,y,n) 随机生成[x,y)之间的n个数
#np.random.randn(n,x,y)随机生成x行y维标准正态分布的array,n个
x = np.sort(np.random.uniform(0,6,N),axis = 0)
y = 2*np.sin(x)  + 0.1*np.random.randn(N)
#reshape(-1,1)中的-1代表无意义
#reshape(-1,1)代表将二维数组重整为一个一列的二维数组
x = x.reshape(-1,1)

'''
运用不同核函数进行支持向量机回归
'''

#运用高斯核函数 C = 100,gamma = 0.4
svr_rbf = SVR(kernel = 'rbf', gamma = 0.4, C = 100)
svr_rbf.fit(x,y)

#运用线性核函数
svr_lin = SVR(kernel = 'linear', C = 100)
svr_lin.fit(x,y)

#运用多项式核函数
svr_poly = SVR(kernel = 'poly', degree = 3, C = 100)
svr_poly.fit(x,y)

'''
生成测试集数据,使用使用相同的方式
'''
np.random.seed(0)
x_test = np.sort(np.random.uniform(0,9,N),axis = 0)
y_test = 2*np.sin(x_test)  + 0.1*np.random.randn(N)
x_test = x_test.reshape(-1,1)


'''
预测并生成图表
'''
y_rbf = svr_rbf.predict(x_test)
y_lin = svr_lin.predict(x_test)
y_poly = svr_poly.predict(x_test)
#绘制图像
plt.figure(figsize = (9,8),facecolor = 'w')#figsize指定画布大小
#plt.scatter(x_test, y_test, s = 6,label = 'test data')
plt.plot(x,y,'ks',markersize = 5, label = 'train data')
plt.plot(x_test, y_test,'mo', markersize = 6,label = 'test data')
plt.plot(x_test, y_rbf,'r-', lw=2, label='RBF')
plt.plot(x_test, y_lin,'g-', lw=2, label='Linear')
plt.plot(x_test, y_poly,'b-', lw=2, label='Polynomial')
#获取支持向量,zorder整数越大,显示时越靠上
plt.scatter(x[svr_rbf.support_], y[svr_rbf.support_], s = 200, c = 'r',
            marker = '*',label = 'RBF Support Vectors',zorder = 10)

plt.xlabel('x')
plt.ylabel('y')
plt.title('SVR')
plt.legend()
plt.show()


'''
获取预测误差
'''
print("高斯核函数支持向量机的平均绝对误差为:",mean_absolute_error(y_test,y_rbf))
print("高斯核函数支持向量机的均方误差为:",mean_squared_error(y_test,y_rbf))

print("线性核函数支持向量机的平均绝对误差为:",mean_absolute_error(y_test,y_lin))
print("线性核函数支持向量机的均方误差为:",mean_squared_error(y_test,y_lin))

print("多项式核函数支持向量机的平均绝对误差为:",mean_absolute_error(y_test,y_poly))
print("多项式核函数支持向量机的均方误差为:",mean_squared_error(y_test,y_poly))


'''
进一步测试SVR算法技能
选取最优参数

使用GridSearchCV()函数,它存在的意义就是自动调参,
只要把参数输进去,就能给出最优化的结果和参数。

GridSearchCV(estimator, param_grid, cv=None)
estimator :选择使用的分类器,并且传入除需要确定最佳的参数之外的其他参数。
param_grid :需要最优化的参数的取值,值为字典或者列表。
cv :交叉验证参数,默认None,使用三折交叉验证。
'''
model = SVR(kernel = 'rbf')
c_can = np.linspace(105,107,10) #等间距提取数值
gamma_can = np.linspace(0.4,0.5,10)
print('c_can :',c_can)
print('gamma_can :',gamma_can)
svr_rbf_G = GridSearchCV(model,param_grid={'C' : c_can, 'gamma' : gamma_can},cv = 5)
svr_rbf_G.fit(x,y)
print('选取的最佳组合参数为:',svr_rbf_G.best_params_)

'''
预测并生成图表
'''
y_predict = svr_rbf_G.predict(x_test)  #获取新的预测
sp = svr_rbf_G.best_estimator_.support_ #获取支持向量坐标
plt.figure(figsize = (9,8),facecolor = 'w')#figsize指定画布大小
plt.scatter(x[sp], y[sp], s = 200, c = 'r',marker = '*',label = 'Support Vectors',zorder = 10)
plt.plot(x_test, y_predict,'r-', lw=2, label='RBF Predict')
plt.plot(x,y,'ks',markersize = 5, label='train data')
plt.plot(x_test, y_test,'mo', markersize = 5, label='test data')
plt.legend(loc = 'lower left')
plt.title('SVR',fontsize = 16)
plt.xlabel('X')
plt.ylabel('Y')
plt.grid(True) #绘制网格背景板
plt.show()

#获取预测误差
print("选取最优参数的高斯核函数支持向量机的平均绝对误差为:",mean_absolute_error(y_test,y_predict))
print("选取最优参数的高斯核函数支持向量机的均方误差为:",mean_squared_error(y_test,y_predict))


