机器学习特征构建
Data scientist and ML experts often find it difficult to showcase their findings/result to others. Mostly ,power point or any web development tools are required to explain the results. With the introduction of Streamlit , it has become easier to develop web apps with python. We can also create multiple models and show the results based on the user selection. This comes as an easy-go hand in library specially for analyst or persons who would like to show a POC kind of solutions to the clients or to other team members. In this article, I have not detailed on the machine learning algorithms used as it is not the scope.
数据科学家和ML专家通常很难向他人展示他们的发现/结果。 通常,需要使用Power Point或任何Web开发工具来解释结果。 随着Streamlit的引入,使用python开发Web应用程序变得更加容易。 我们还可以创建多个模型并根据用户选择显示结果。 这是易于使用的资料库,专门供分析人员或想向客户或其他团队成员展示POC解决方案的人员使用。 在本文中,我没有详细介绍所使用的机器学习算法,因为它不是范围。
Streamlit is an open-source python framework that allows us to create interactive websites for machine learning and data science related requirements[1]. In this article, we will develop a web app for classification algorithm where the user will be able to select the algorithm on which the model should be built, the model parameters and visualize the corresponding results of the model.
Streamlit是一个开放源代码的python框架,允许我们创建用于机器学习和数据科学相关要求的交互式网站[1]。 在本文中,我们将开发一个用于分类算法的Web应用程序,在该应用程序中,用户将能够选择应在其上构建模型的算法,模型参数并可视化模型的相应结果。
1. Data Set :
1.数据集:
For demonstration purpose, I have taken a smaller diabetes dataset from the following link (Kaggle). The objective of the dataset is to predict whether a patient is diabetic or non-diabetic. Personally speaking, I have only explored with smaller and medium size datasets using streamlit.
为了演示,我从下面的链接( Kaggle )中获取了一个较小的糖尿病数据集。 数据集的目的是预测患者是糖尿病患者还是非糖尿病患者。 就个人而言,我仅使用streamlit探索了中小型数据集。
2. Installing Streamlit :
2.安装Streamlit:
Let us begin by installing Streamlit using the command :
让我们开始使用以下命令安装Streamlit:
pip install streamlit
点安装streamlit
Run the following command to ensure that the installation is working,
运行以下命令以确保安装正常进行,
streamlit hello
流光打招呼
To run a web app, run the command,
要运行网络应用,请运行以下命令,
streamlit run
流式运行
This command will open a browser, where the web app will be displayed. If any changes are made to the source file, we can dynamically observe the changes in the app by using the re-run option.
此命令将打开一个浏览器,将在其中显示Web应用程序。 如果对源文件进行了任何更改,我们可以使用re-run选项动态观察应用程序中的更改。
3. Streamlit Components:
3. Streamlit组件:
This article will discuss about the following components and how they are used in our machine learning web app,
本文将讨论以下组件以及它们在我们的机器学习网络应用中的使用方式,
• Checkbox
•复选框
• Title
•标题
• Sidebar
•侧边栏
• Markdown
•降价促销
• Selectbox (drop-box)
•选择框(下拉框)
• Multi-select
• 多选
• Radio (radio buttons)
•单选(单选按钮)
• Number Input box
•数字输入框
• Slider
•滑杆
• Caching
•缓存
• Button
•按钮
Let us now import the streamilt and other necessary libraries for our machine learning model,
现在,让我们为我们的机器学习模型导入streamilt和其他必要的库,
import streamlit as stimport pandas as pdimport numpy as npfrom sklearn.svm import SVCfrom sklearn.linear_model import LogisticRegressionfrom sklearn.ensemble import RandomForestClassifierfrom sklearn.tree import DecisionTreeClassifierfrom sklearn.preprocessing import LabelEncoderfrom sklearn.model_selection import train_test_splitfrom sklearn.metrics import plot_confusion_matrix, plot_roc_curve, plot_precision_recall_curvefrom sklearn.metrics import precision_score, recall_scoreTitle, Sidebar and Markdown
标题,边栏和减价
To start with, let us add a title and sidebar to out app as below,
首先,让我们如下向out应用添加标题和侧边栏,
 st.title(“Predicting Diabetes Web App”)
 st.sidebar.title(“Model Selection Panel”)
 st.markdown(“Affected by Diabetes or not ?”)
 st.sidebar.markdown(“Choose your model and its parameters”)
The title function adds a title to our web app, the sidebar creates a side-panel like component for the app. Streamlit also provides with a facility of markdown using markdown function.
标题功能为我们的网络应用程序添加了一个标题, 侧边栏为该应用程序创建了类似于侧面板的组件。 Streamlit还使用markdown功能提供了markdown功能。
Checkbox
选框
Let us now learn how to add a checkbox at the sidebar to the app. In this app, we use the checkbox to load the data from our csv file . The syntax for adding checkbox is : checkbox(.
现在让我们学习如何在侧边栏为应用程序添加一个复选框。 在此应用中,我们使用复选框从csv文件中加载数据。 添加复选框的语法是: checkbox(<我们复选框的标签>,
def load_data(): data = pd.read_csv(“diabetes.csv”)return datadf=load_data()if st.sidebar.checkbox(“Show raw data”, False): st.subheader(“Diabetes Raw Dataset”) st.write(df)Since the option is for the checkbox is “False”, the checkbox will be unchecked while the web app loads. After running the web app , the app can be visualized as below,
由于复选框的选项为“ False”,因此在加载Web应用程序时将取消选中该复选框。 运行网络应用后,该应用可以如下显示,
Caching
快取
Streamlit provides a functionality called caching, where data is not loaded each time when the app is loaded. Unless the data source is changed , the data is loaded from the cache and thus saving cpu cycles and memory time. i.e. Caching mechanism that allows your app to stay performant even when loading data from the web, manipulating large datasets, or performing expensive computations[1]. This is done with the help of the decorator @st.cache which is added before the function that requires the caching mechanism. In our case, it is added at the start of the data load function.
Streamlit提供了一种称为缓存的功能,该功能在每次加载应用程序时都不会加载数据。 除非更改数据源,否则将从缓存中加载数据,从而节省CPU周期和内存时间。 即缓存机制,即使从Web加载数据,处理大型数据集或执行昂贵的计算,也可以使您的应用保持高性能。[1] 这是在装饰器@ st.cache的帮助下完成的,该装饰器在需要缓存机制的函数之前添加。 在我们的情况下,它是在数据加载功能开始时添加的。
#@st.cache(allow_output_mutation=True)
 @st.cache(persist=True)
 def load_data():
  data = pd.read_csv(“diabetes.csv”)
 return data
The streamlit expects that the functions decorated with cache is not mutated within the function body.i.e. if the data that to be cached should not be changed during the course of the app. To by pass this , st.cache provides an option with allow_output_mutation=True and many such options which can be referred from their official site.
精打细算的人希望用缓存装饰的功能不会在函数体内发生突变,即,如果不应在应用程序运行期间更改要缓存的数据。 为了绕过这个问题,st.cache提供了一个allow_output_mutation = True的选项以及许多这样的选项,可以从其官方站点引用它们。
Drop-down
落下
The selectbox helps in adding a drop-down box for the app. For our app, we have used this feature to aid us in selecting the different classifiers that will be used in creating the machine learning model. The syntax is : selectbox(“
选择框有助于为应用添加一个下拉框。 对于我们的应用程序,我们已经使用此功能来帮助我们选择将用于创建机器学习模型的不同分类器。 语法为: selectbox(“ <选择框的名称”,(“ <要进入下拉菜单的选项”>)) 。
st.sidebar.subheader(“Select your Classifier”)
classifier = st.sidebar.selectbox(“Classifier”, (“Decision Tree”,”Support Vector Machine (SVM)”, “Logistic Regression”, “Random Forest”))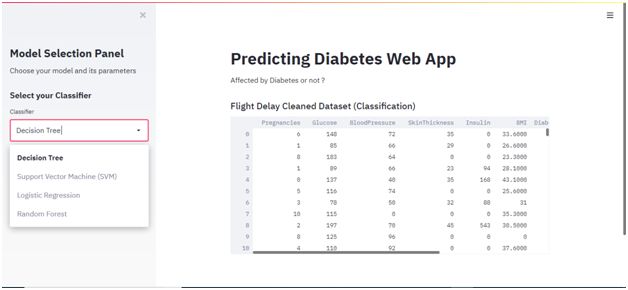
Multiselect
多选
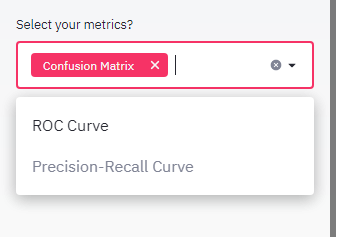
Multiselect widget allows the user to make multiple selections in a list box. In our app, we use this widget to choose the metrics for evaluating our machine learning model. Let us use Confusion Matrix, ROC and Precision-Recall curve to evaluate our model. The multiselect follows the syntax very similar to select box as : multiselect(“. Now, let us include it in our app and re-run our app to see the changes.
Multiselect小部件允许用户在列表框中进行多项选择。 在我们的应用程序中,我们使用此小部件选择评估我们的机器学习模型的指标。 让我们使用混淆矩阵,ROC和Precision-Recall曲线评估模型。 多重选择遵循与选择框非常相似的语法: multiselect(“ <多重选择的标签>”,(('<要显示的选项>'))) 。 现在,让我们将其包含在我们的应用程序中,然后重新运行我们的应用程序以查看更改。
metrics = st.sidebar.multiselect(“Select your metrics : “, (‘Confusion Matrix’, ‘ROC Curve’, ‘Precision-Recall Curve’))Radio
无线电
This widget adds radio button to our app. It can be done with the help of the syntax : radio(. In our app, one such place where we use them in selecting the criteria on which the decision tree algorithm works.
此小部件将单选按钮添加到我们的应用程序。 可以借助以下语法完成此操作: radio (<单选按钮的标签>,<要显示的选项>,<用于第一次渲染的预选选项的索引>,<用于更改标签的功能单选按钮>,key = <窗口小部件的唯一键,可用于在我们应用程序的其他部分中引用>) 。 在我们的应用程序中,我们使用它们来选择决策树算法所依据的标准。
criterion= st.sidebar.radio(“Criterion(measures the quality of split)”, (“gini”, “entropy”), key=’criterion’)Slider
滑杆
Let us discuss on how to add a sliding widget to our app. The syntax is as follows : slider(). In our app, we have used slider in adjusting the regularization parameter for logistic regression.
让我们讨论如何向我们的应用添加滑动小部件。 语法如下: slider ( < slider 标签>,<滑块应在其中开始的最小值>,<可以使用该滑块之前的最大值>,<要在其第一次渲染时显示的值>,step = <滑块应增加/减少的步长>,key = <滑块的唯一键> )。 在我们的应用程序中,我们已使用滑块调整逻辑回归的正则化参数。
Number Input box
号码输入框
Displays a numeric input widget where the users can input their numbers .
显示一个数字输入小部件,用户可以在其中输入数字。
number_input(
number_input (
Eg :
例如:
n_estimators = st.sidebar.number_input(“The number of trees in the forest”, 100, 5000, step=10, key=’n_estimators’)Button
纽扣
This displays a clickable button on our app which can be added by the syntax : button(
这会在我们的应用程序上显示一个可单击的按钮,该按钮可以通过以下语法添加: button ( <按钮用途的描述>,key = <按钮的唯一ID> )。
button(“Classify”, key=’classify’)I have discussed few widgets, you can find more like progress bar, text_input and so on from Streamlit official documentation. The entire python script for the app is below, which yo can directly execute after installing streamlit to your python environment.
我讨论了一些小部件,您可以从Streamlit官方文档中找到更多类似进度条,text_input等的小部件。 该应用程序的整个python脚本在下面,您可以在将streamlit安装到python环境后直接执行。
############ Import the required Libraries ##################
import streamlit as st
import pandas as pd
import numpy as np
from sklearn.svm import SVC
from sklearn.linear_model import LogisticRegression
from sklearn.ensemble import RandomForestClassifier
from sklearn.tree import DecisionTreeClassifier
from sklearn.preprocessing import LabelEncoder
from sklearn.model_selection import train_test_split
from sklearn.metrics import plot_confusion_matrix, plot_roc_curve, plot_precision_recall_curve
from sklearn.metrics import precision_score, recall_scoredef main():
 st.title(“Predicting Diabetes Web App”)
 st.sidebar.title(“Model Selection Panel”)
 st.markdown(“Affected by Diabetes or not ?”)
 st.sidebar.markdown(“Choose your model and its parameters”)#@st.cache(allow_output_mutation=True)
 @st.cache(persist=True)
 def load_data():# Function to load our dataset
 data = pd.read_csv(“diabetes.csv”)
 return data

 def split(df):# Split the data to ‘train and test’ sets
 req_cols = [‘Pregnancies’, ‘Insulin’, ‘BMI’, ‘Age’,’Glucose’,’BloodPressure’,’DiabetesPedigreeFunction’]
 x = df[req_cols] # Features for our algorithm
 y = df.Outcome
 x = df.drop(columns=[‘Outcome’])
 x_train, x_test, y_train, y_test = train_test_split(x, y, test_size=0.3, random_state=0)
 return x_train, x_test, y_train, y_test

 def plot_metrics(metrics_list):
 if ‘Confusion Matrix’ in metrics_list:
 st.subheader(“Confusion Matrix”)
 plot_confusion_matrix(model, x_test, y_test, display_labels=class_names)
 st.pyplot()if ‘ROC Curve’ in metrics_list:
 st.subheader(“ROC Curve”)
 plot_roc_curve(model, x_test, y_test)
 st.pyplot()

 if ‘Precision-Recall Curve’ in metrics_list:
 st.subheader(‘Precision-Recall Curve’)
 plot_precision_recall_curve(model, x_test, y_test)
 st.pyplot()

 df=load_data()
 class_names = [‘Diabetec’, ‘Non-Diabetic’]
 x_train, x_test, y_train, y_test = split(df)


 st.sidebar.subheader(“Select your Classifier”)
 classifier = st.sidebar.selectbox(“Classifier”, (“Decision Tree”, “Logistic Regression”, “Random Forest”))if classifier == ‘Decision Tree’:
 st.sidebar.subheader(“Model parameters”)
 #choose parameters

 criterion= st.sidebar.radio(“Criterion(measures the quality of split)”, (“gini”, “entropy”), key=’criterion’)
 splitter = st.sidebar.radio(“Splitter (How to split at each node?)”, (“best”, “random”), key=’splitter’)

 metrics = st.sidebar.multiselect(“Select your metrics : “, (‘Confusion Matrix’, ‘ROC Curve’, ‘Precision-Recall Curve’))

 if st.sidebar.button(“Classify”, key=’classify’):
 st.subheader(“Decision Tree Results”)
 model = DecisionTreeClassifier(criterion=criterion, splitter=splitter)
 model.fit(x_train, y_train)
 accuracy = model.score(x_test, y_test)
 y_pred = model.predict(x_test)
 st.write(“Accuracy: “, accuracy.round(2)*100,”%”)
 st.write(“Precision: “, precision_score(y_test, y_pred, labels=class_names).round(2))
 st.write(“Recall: “, recall_score(y_test, y_pred, labels=class_names).round(2))
 plot_metrics(metrics)

 if classifier == ‘Logistic Regression’:
 st.sidebar.subheader(“Model Parameters”)
 C = st.sidebar.number_input(“C (Regularization parameter)”, 0.01, 10.0, step=0.01, key=’C_LR’)
 max_iter = st.sidebar.slider(“Maximum number of iterations”, 100, 500, key=’max_iter’)metrics = st.sidebar.multiselect(“Select your metrics?”, (‘Confusion Matrix’, ‘ROC Curve’, ‘Precision-Recall Curve’))if st.sidebar.button(“Classify”, key=’classify’):
 st.subheader(“Logistic Regression Results”)
 model = LogisticRegression(C=C, penalty=’l2', max_iter=max_iter)
 model.fit(x_train, y_train)
 accuracy = model.score(x_test, y_test)
 y_pred = model.predict(x_test)
 st.write(“Accuracy: “, accuracy.round(2)*100,”%”)
 st.write(“Precision: “, precision_score(y_test, y_pred, labels=class_names).round(2))
 st.write(“Recall: “, recall_score(y_test, y_pred, labels=class_names).round(2))
 plot_metrics(metrics)

 if classifier == ‘Random Forest’:
 st.sidebar.subheader(“Model Hyperparameters”)
 n_estimators = st.sidebar.number_input(“The number of trees in the forest”, 100, 5000, step=10, key=’n_estimators’)
 max_depth = st.sidebar.number_input(“The maximum depth of the tree”, 1, 20, step=1, key=’n_estimators’)
 bootstrap = st.sidebar.radio(“Bootstrap samples when building trees”, (‘True’, ‘False’), key=’bootstrap’)
 metrics = st.sidebar.multiselect(“What metrics to plot?”, (‘Confusion Matrix’, ‘ROC Curve’, ‘Precision-Recall Curve’))if st.sidebar.button(“Classify”, key=’classify’):
 st.subheader(“Random Forest Results”)
 model = RandomForestClassifier(n_estimators=n_estimators, max_depth=max_depth, bootstrap=bootstrap, n_jobs=-1)
 model.fit(x_train, y_train)
 accuracy = model.score(x_test, y_test)
 y_pred = model.predict(x_test)
 st.write(“Accuracy: “, accuracy.round(2)*100,”%”)
 st.write(“Precision: “, precision_score(y_test, y_pred, labels=class_names).round(2))
 st.write(“Recall: “, recall_score(y_test, y_pred, labels=class_names).round(2))
 plot_metrics(metrics)
 if st.sidebar.checkbox(“Show raw data”, False):
 st.subheader(“Diabetes Raw Dataset”)
 st.write(df)


if __name__ == ‘__main__’:
 main()
https://docs.streamlit.io/en/stable/getting_started.html.
https://docs.streamlit.io/en/stable/getting_started.html 。
https://www.datacamp.com/community/tutorials/decision-tree-classification-python.
https://www.datacamp.com/community/tutorials/decision-tree-classification-python 。
https://www.kaggle.com/uciml/pima-indians-diabetes-database?select=diabetes.csv.
https://www.kaggle.com/uciml/pima-indians-diabetes-database?select=diabetes.csv 。
https://www.coursera.org/projects/data-science-streamlit-python.
https://www.coursera.org/projects/data-science-streamlit-python 。
https://www.coursera.org/projects/machine-learning-streamlit-python.
https://www.coursera.org/projects/machine-learning-streamlit-python 。
翻译自: https://medium.com/analytics-vidhya/build-your-basic-machine-learning-web-app-with-streamlit-60e29e43f5f7
机器学习特征构建