机器学习算法-用Python实现Adaline(自适应线性神经元)代码
用Python实现Adaline(自适应线性神经元)代码
import numpy as np
import pandas as pd
import matplotlib.pyplot as plt
from matplotlib.colors import ListedColormap

df = pd.read_csv('你自己的目录\\iris.data', header=None)
print(df.head())
# select setosa and versicolor
y = df.iloc[0:100, 4].values
y = np.where(y == 'Iris-setosa', -1, 1)

# extract sepal length and petal length
X = df.iloc[0:100, [0, 2]].values.astype(np.float32)

class AdalineGD(object):
    """ADAptive LInear NEuron classifier.

    Parameters
    ------------
    eta : float
      Learning rate (between 0.0 and 1.0)
    n_iter : int
      Passes over the training dataset.
    random_state : int
      Random number generator seed for random weight
      initialization.


    Attributes
    -----------
    w_ : 1d-array
      Weights after fitting.
    cost_ : list
      Sum-of-squares cost function value in each epoch.

    """
    def __init__(self, eta=0.01, n_iter=50, random_state=1):
        self.eta = eta
        self.n_iter = n_iter
        self.random_state = random_state

    def fit(self, X, y):
        """ Fit training data.

        Parameters
        ----------
        X : {array-like}, shape = [n_samples, n_features]
          Training vectors, where n_samples is the number of samples and
          n_features is the number of features.
        y : array-like, shape = [n_samples]
          Target values.

        Returns
        -------
        self : object

        """
        # rgen为NumPy随机数生成器,随机种子由用户指定,保证在需要时可以重现以前的结果。
        rgen = np.random.RandomState(self.random_state)
        # 产生标准差为0.01的 正态分布
        self.w_ = rgen.normal(loc=0.0, scale=0.01, size=1 + X.shape[1])
        self.cost_ = []

        for i in range(self.n_iter):
            net_input = self.net_input(X)
            print("net_input:", net_input)
            # Please note that the "activation" method has no effect
            # in the code since it is simply an identity function. We
            # could write `output = self.net_input(X)` directly instead.
            # The purpose of the activation is more conceptual, i.e.,
            # in the case of logistic regression (as we will see later),
            # we could change it to
            # a sigmoid function to implement a logistic regression classifier.
            output = self.activation(net_input)
            errors = (y - output)
            print("errors:", errors)
            self.w_[1:] += self.eta * X.T.dot(errors)
            self.w_[0] += self.eta * errors.sum()
            cost = (errors**2).sum() / 2.0
            self.cost_.append(cost)
            print("self.w_[:]:", self.w_[:])
        return self

    def net_input(self, X):
        """Calculate net input"""
        return np.dot(X, self.w_[1:]) + self.w_[0]

    def activation(self, X):
        """Compute linear activation"""
        return X

    def predict(self, X):
        """Return class label after unit step"""
        return np.where(self.activation(self.net_input(X)) >= 0.0, 1, -1)

fig, ax = plt.subplots(nrows=1, ncols=2, figsize=(10, 4))

ada1 = AdalineGD(n_iter=10, eta=0.01).fit(X, y)
ax[0].plot(range(1, len(ada1.cost_) + 1), np.log10(ada1.cost_), marker='o')
ax[0].set_xlabel('Epochs')
ax[0].set_ylabel('log(Sum-squared-error)')
ax[0].set_title('Adaline - Learning rate 0.01')

ada2 = AdalineGD(n_iter=10, eta=0.0001).fit(X, y)
ax[1].plot(range(1, len(ada2.cost_) + 1), ada2.cost_, marker='o')
ax[1].set_xlabel('Epochs')
ax[1].set_ylabel('Sum-squared-error')
ax[1].set_title('Adaline - Learning rate 0.0001')

# plt.savefig('images/02_11.png', dpi=300)
plt.show()
执行结果:
0 1 2 3 4
0 5.1 3.5 1.4 0.2 Iris-setosa
1 4.9 3.0 1.4 0.2 Iris-setosa
2 4.7 3.2 1.3 0.2 Iris-setosa
3 4.6 3.1 1.5 0.2 Iris-setosa
4 5.0 3.6 1.4 0.2 Iris-setosa
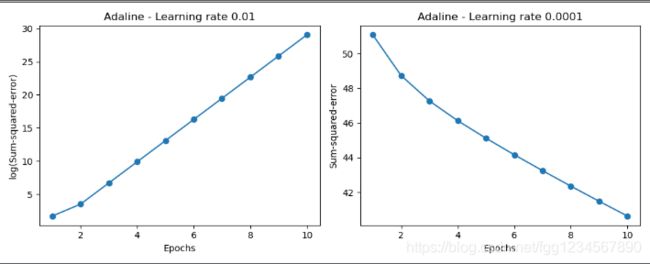
根据两种不同的学习率画出代价与迭代次数之间的关系图。正如从下面绘制的代价函数图所看到的,有两种不同类型的问题。左图显示选择太大的学习率所出现的情况。因为选择的全局最小值过低,无法最 小化代价函数,误差经过每次迭代变得越来越大。另一方面,可以看到代价在右图降低,但所选择的学习率η=0.000 1是如此之小,以至于算法需要经过多次迭代才能收敛到全局最低代价
