python机器学习笔记(二):分类算法——Adaline
有关梯度函数的文章:
[机器学习] ML重要概念:梯度(Gradient)与梯度下降法(Gradient Descent)
http://blog.csdn.net/walilk/article/details/50978864
深入浅出–梯度下降法及其实现
https://www.jianshu.com/p/c7e642877b0e
梯度下降法的原理与实现
https://blog.csdn.net/dpengwang/article/details/86028041
- 梯度下降算法
#梯度下降
import numpy as np

row = 4
x0 = np.zeros((row,1))
x1 = np.arange(0, row+0).reshape(row, 1)
x2 = np.arange(2, row+2).reshape(row,1)
x3 = np.arange(1, row+1).reshape(row,1)
#x 20行3列
x = np.hstack((x1,x2,x3))  #np.vstack()在竖直方向上堆叠;np.hstack()在水平方向上平铺
#y 20行1列
#y = 1*x1 + 2*x2 + 3*x3 + np.random.random(row).reshape(row, 1)  ##np.random.random()生成随机浮点数
y = 1*x1 + 2*x2 + 3*x3 + np.array([2,1,3,1]).reshape(row,1)
print(x)
print(y)
#定义代价函数(误差)
def error_function(theta, x, y):  #theta是权重
    diff = np.dot(x, theta) - y   ##diff是误差值
    return (1./2*row)*np.dot(np.transpose(diff), diff)   #返回的是误差函数的值

#求梯度的函数
def gradient_function(theta, x, y):
    diff = np.dot(x, theta) - y
    return (1./row)*np.dot(np.transpose(x), diff)  #返回的是梯度函数的值,用来更新权重


#利用梯度下降法不断迭代参数
def gradient_descent(x, y, alpha):
    theta = np.array([1, 1, 1]).reshape(3, 1)  #初始化权重,权重的行数为X的列数(一个权重对应一个维度)
    gradient = gradient_function(theta, x, y)
    while not np.all(np.absolute(gradient) <= 1e-5):   #np.absolute() 取绝对值
        theta = theta - alpha*gradient  ##更新权重?这没有设置偏置项吧??
        gradient = gradient_function(theta, x, y)
        print('不符合,更新',gradient)
    return theta  #返回权重

alpa = 0.001
theta = gradient_descent(x, y, alpa)
print(theta)
- 自适应式线性神经元 Adaline算法
##自适应式线性神经元 Adaline算法
class AdalineGD(object):

    def __init__(self, eta=0.01, n_iter=50):
        self.eta = eta
        self.n_iter = n_iter

    def fit(self,X,y):
        self.w_ = np.zeros(1 + X.shape[1])
        self.cost_ = []  #存储代价函数的输出值以检查本轮训练后算法是否收敛

        for i in range(self.n_iter):
            output = self.net_input(X)   #output为预测值
            errors = (y - output)       #误差
            self.w_[1:] += self.eta*X.T.dot(errors)  #更新梯度1~m位置的权重  X.T.dot(errors)是X的转置与误差向量之间的乘积
            self.w_[0] += self.eta*errors.sum()  #更新梯度第0个位置的权重
            cost = (errors**2).sum()/2.0  #误差函数
            self.cost_.append(cost)
        return self

    def net_input(self, X):
        return np.dot(X, self.w_[1:]) + self.w_[0]      #预测函数y = w0 + w1*x1+ w2*x2 + ....+ wn*xn

    def activation(self, X):
        return self.net_input(X)

    def predict(self, X):
        return np.where(self.activation(X) >= 0.0, 1, -1)
#基于鸢尾花数据集训练感知器模型---数据可视化
import pandas as pd
import matplotlib.pyplot as plt
import numpy as np
df = pd.read_csv('https://archive.ics.uci.edu/ml/machine-learning-databases/iris/iris.data',header=None)
df.tail()
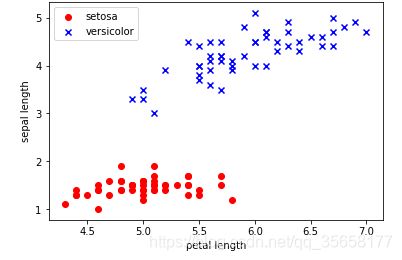
##从中提取100个类标,其中分别包含50个山鸢尾类标和50个变色鸢尾类标,并将这些类标用两个整数值来表示,1代表变色鸢尾,-1代表山鸢尾,赋值给y
##提取这100个训练样本的第一个特征值列(萼片长度)和第三个特征列(花瓣长度),并赋值给属性矩阵X
##可视化
y = df.iloc[0:100, 4].values
y = np.where(y == 'Iris-setosa', -1, 1)
X = df.iloc[0:100, [0, 2]].values
plt.scatter(X[:50, 0], X[:50, 1], color='red', marker='o', label='setosa')
plt.scatter(X[50:100, 0], X[50:100, 1], color='blue', marker='x', label='versicolor')
plt.xlabel('petal length')
plt.ylabel('sepal length')
plt.legend(loc='upper left')
plt.show()
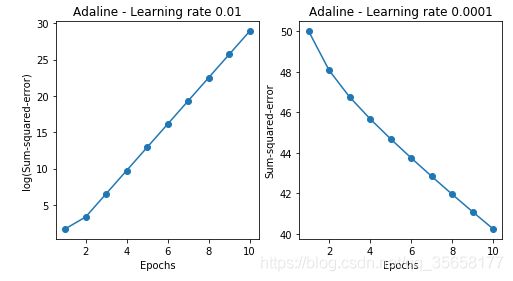
fig, ax = plt.subplots(nrows=1, ncols=2, figsize=(8, 4))
adal = AdalineGD(n_iter=10, eta=0.01).fit(X,y)
ax[0].plot(range(1, len(adal.cost_) + 1),
          np.log10(adal.cost_),marker='o')
ax[0].set_xlabel('Epochs')
ax[0].set_ylabel('log(Sum-squared-error)')
ax[0].set_title('Adaline - Learning rate 0.01')
ada2 = AdalineGD(n_iter=10, eta=0.0001).fit(X, y)
ax[1].plot(range(1, len(ada2.cost_) + 1),
          ada2.cost_, marker='o')
ax[1].set_xlabel('Epochs')
ax[1].set_ylabel('Sum-squared-error')
ax[1].set_title('Adaline - Learning rate 0.0001')
plt.show()
##对样本进行标准化处理(使数据具备标准正态分布的特性:特征值的均值=0,标准差=1)
X_std = np.copy(X)
X_std[:,0] = (X[:,0] - X[:,0].mean())/X[:,0].std()
X_std[:,1] = (X[:,1] - X[:,1].mean())/X[:,1].std()

ada = AdalineGD(n_iter=15, eta=0.01)
ada.fit(X_std, y)
plot_decision_regions(X_std, y, classifier=ada)
plt.title('Adaline - Gradient Descent')
plt.xlabel('sepal length [standardized]')
plt.ylabel('petal length [satrdardized]')
plt.legend(loc='upper left')
plt.show()
plt.plot(range(1, len(ada.cost_) + 1), ada.cost_, marker='o')
plt.xlabel('Epochs')
plt.ylabel('Sum-squared-error')
plt.show()
#对二维数据集决策边界的可视化
from matplotlib.colors import ListedColormap

def plot_decision_regions(X, y, classifier, resolution=0.02):

    #setup marker genterator and color map
    markers = ('s', 'x', 'o', '^', 'v')
    colors = ('red', 'blue', 'lightgreen', 'gray', 'cyan')
    cmap = ListedColormap(colors[:len(np.unique(y))])

    #plot the decision surface
    x1_min, x1_max = X[:, 0].min() - 1, X[:, 0].max() + 1
    x2_min, x2_max = X[:, 1].min() - 1, X[:, 1].max() + 1
    xx1, xx2 = np.meshgrid(np.arange(x1_min, x1_max, resolution),
                          np.arange(x2_min, x2_max, resolution))
    Z = classifier.predict(np.array([xx1.ravel(), xx2.ravel()]).T)
    Z = Z.reshape(xx1.shape)
    plt.contourf(xx1, xx2, Z, alpha=0.4, cmap=cmap)
    plt.xlim(xx1.min(), xx1.max())
    plt.ylim(xx2.min(), xx2.max())

    #plot class samples
    for idx, cl in enumerate(np.unique(y)):
        plt.scatter(x=X[y == cl, 0],y=X[y == cl, 1],
                   alpha=0.8, c=cmap(idx),
                   marker=markers[idx], label=cl)


