matlab点云聚类,基于区域聚类分割的点云特征线提取
王晓辉
, 吴禄慎
, 陈华伟
, 胡赟
, 石雅莹
. . 基于区域聚类分割的点云特征线提取. 光学学报, 2018, 38(11): 1110001-。
Wang Xiaohui
, Wu Lushen
, Chen Huawei
, Hu Yun
, Shi Yaying
. . Feature Line Extraction from a Point Cloud Based on Region Clustering Segmentation. Acta Agronomica Sinica, 2018, 38(11): 1110001-.
![]()
基于区域聚类分割的点云特征线提取
王晓辉1,2, 吴禄慎1*, 陈华伟1, 胡赟1, 石雅莹1
1南昌大学机电工程学院, 江西 南昌 330031
2赤峰学院建筑与机械工程学院, 内蒙古 赤峰 024000
摘要
提出一种非结构化点云特征线提取方法,其过程主要分为区域分割和特征检测两个阶段。在区域分割阶段,引入社会粒子群优化模糊C-均值聚类算法对点云数据进行区域聚类,得到边界清晰的各个分区,便于后续边界特征的提取;在特征检测阶段,对各个分区进行局部径向基函数曲面重构,以获取各个分区内采样点的曲率信息。提出基于平均曲率计算的局部特征权值,并通过局部特征权值和曲率极值法对特征点进行双重检测。并通过建立特征点的最小生成树构建特征曲线。对不同点云模型进行特征线提取实验,结果表明,本文方法既能够提取点云模型中的显著特征和尖锐特征,也能够很好地提取特征强度变化的曲线特征。
关键词
图像处理; 点云数据; 特征线提取; 区域分割; 局部特征权值; 曲率
Feature Line Extraction from a Point Cloud Based on Region Clustering Segmentation
Wang Xiaohui1,2, Wu Lushen1*, Chen Huawei1, Hu Yun1, Shi Yaying1
1School of Mechatronic Engineering, Nanchang University, Nanchang, Jiangxi 330031, China
2School of Architectural and Mechanical Engineering, Chifeng University, Chifeng, Inner Mongolia 0 24000, China
Abstract
This study presents a novel methodology to extract feature lines from unorganized point clouds. In this study, the extraction of feature lines from point clouds is divided into two stages: region segmentation and feature detection. In the region segmentation stage, the social particle swarm optimization fuzzy C-means clustering algorithm is introduced to cluster the point cloud data; further, each partition is obtained with a clear boundary, which is beneficial to extract the boundary features. In the feature detection stage, local surface reconstruction that is based on the radial basis function is conducted for each partition. Additionally, the curvature values of the sampling points are calculated according to the established local implicit surface; further, local feature weights that are based on the mean curvature are proposed. The feature points can be identified based on the local feature weights using the curvature extremum method. Finally, the feature lines can be generated by establishing the minimum spanning tree of the feature points. Different point cloud models are selected to perform the feature line extraction experiments. The experimental results exhibit that the proposed method can extract significant and sharp features from the point cloud models along with the curve features with intensity variations.
Key words
image processing; point clouds; feature line extraction; region clustering segmentation; local feature weight; curvature
论文信息
doi:10.3788/AOS201838.1110001
OCIS codes:
100.6890; 150.6910; 200.4560
收稿日期:2018-03-22
接受日期:2018-05-28
基金项目:国家自然科学基金51065021,51365037,51705229
1 引言
点云数据的特征提取是计算机可视化、数字几何处理及逆向工程等领域中的一项重要研究内容, 已广泛用于曲面重建、数据分割、曲线匹配和拼接等几何处理中。目前, 对点云特征提取的研究主要集中在对特征线的提取及运算上。在三维点云数据中, 特征线是特征点的有序连接, 可用于反映三维模型的表面结构特征及其几何形状。通过对三维点云数据进行分析, 可准确识别能代表点云模型特征的数据点, 从而获得特征曲线。
点云数据的特征提取是指从点云模型中识别出几何模型的轮廓、尖锐处、凸凹处和过渡光滑处的结构特征及形状特征的过程。特征提取主要有基于点和基于三角网格2种方式。学者们从分析点云数据的邻域信息及几何特性方面入手, 对特征线提取问题展开了研究。Gumhold等[通过计算邻域图建立局部点云之间的连接信息, 并用主成分分析法确定特征点, 但对曲面凹凸性差别小的谷脊特征提取效果较差; Pauly等[在前述方法的基础上引入多尺度分析, 通过分析局部邻域内的点成为特征点的可能性, 以此来识别特征点, 这种方法更为稳健抗噪。Demarsin等[提出了一种基于图论的点云特征线提取算法。采用一级分割法提取候选特征点, 并对其进行图形化处理重新获得尖锐特征线, 构造最小生成树重新连接特征线, 但该算法仅能应用于均匀分布的点云数据。Kim等[使用近似移动最小二乘法, 通过逼近曲面来估计曲率及其导数, 然后, 利用Delaunay三角剖分来计算邻域信息, 从而提取谷脊点。但该方法不能用于包含少量邻域点的尖锐点处。Ni等[提出了一种邻域几何属性分析方法(AGPN), 用于检测点云的三维边缘和跟踪特征线。在边缘检测步骤中, 通过分析每个查询点邻域的几何性质, 结合随机采样一致性(RANSAC)和角间隙度量来检测边缘。在特征线跟踪步骤中, 采用基于区域生长和模型拟合的混合方法跟踪特征线。该方法可靠性好, 且AGPN对输入数据的点密度不敏感。Altantsetseg等[使用截取的傅里叶级数检测点云中的特征点, 并使用曲率加权拉普拉斯算子平滑方法稀疏潜在特征点, 再通过增加提取点来构造特征线, 并投影到原始点云上。聂建辉等[将符号曲面变化度与特征区域分割相结合, 为点云数据提供了一种有效的特征线提取方法。但是该方法在强噪声的情况下, 易导致提取的特征线出现断裂和缺损的情况。
在点云数据获取过程中, 噪声和数据的不完整会直接影响点云特征的提取效果。为此, 学者们通过引入数学方法来对特征提取算法进行改进。Park等[提出了一种基于张量投票理论的新方法, 可从包含随机噪声、孤立点和伪影的非结构化点云中提取尖锐特征, 且对噪声起到了很好的抵制作用。Liu等[使用多尺度算子, 即法线的差来检测潜在特征线附近的特征点。Zhang等[将基于泊松分布的统计模型作为一种工具用于从点云中提取特征点。该方法不需要预先进行曲面重构, 并且不受噪声点、邻域尺度或点云采样质量的影响。李明磊等[提出了一种基于体素生长的点云结构直线段提取方法, 以体素为单位进行邻域判断, 并采用基于体素的区域生长对结构直线段的分布区域进行分割, 根据分布区域的范围及其所在平面的数学方程实现对特征的提取和优化。该方法可以准确高效地得到较为理想的特征提取结果。
对于结构复杂的点云模型, 为了能使曲面的参数线在局部区域保持与几何特征的对应关系, 可以先对点模型进行分区。张爱武等[提出了一种机载LiDAR点云分类的自适应特征选择方法, 其依据地形起伏情况对整体点云数据进行区域划分, 自适应选择适宜该区域LiDAR点云分类的特征集合。该方法可以有效地降低特征维数, 缩短运算时间, 且分类精度较高。Weber等[提出了一种使用高斯映射聚类进行特征检测的技术, 利用高斯映射聚类对局部邻域上当前点组成的三角形的法向进行聚类, 依据聚类个数判别特征点。该方法对尖锐特征信息敏感, 但是对强度渐变的特征信息无法提取。Xu等[研究了一种分割曲面和从不规则断裂碎片的三角网格中提取边缘特征线的新方法, 通过使用基于顶点法向量的聚类算法来完成粗糙表面分割。为了区分原始面和断裂面, 又引入了一种新的积分不变量来计算表面粗糙度。通过基于面法向量和粗糙度合并面来实现精确的表面分割, 再基于表面分割提取边缘特征线。Bazazian等[提出一种基于分割的多尺度边缘提取技术。根据测地距离通过全局分析对点云进行分割, 再根据局部邻域定义多尺度算子。通过在点云的多个尺度上应用该算子, 以确定特征的持续性。该方法提高了边缘的检测精度, 且具有较好的稳健性。
由上述分析可知, 点云特征提取结果主要受噪声干扰、数据的离散性和不完整性, 以及点云模型自身的复杂性和多样性等因素的影响较大。现有的方法对点云模型的轮廓线、棱线等提取效果较好, 但对过渡特征的提取仍存在一定的缺陷。过渡特征线是开曲线, 过度强调其闭合特性并不能求取所有特征线。为此, 本文提出了基于区域聚类分割的无组织点云特征线提取新方法。其应用社会粒子群优化模糊C-均值(SPSO-FCM)聚类算法对点云模型进行分区, 将其划分为具有几何特征相似性的多个区域, 且使曲面的参数线在局部区域保持与几何特征的对应关系, 得到区域边界清晰的各个分区。然后对每一分区进行局部径向基函数(RBF)曲面重构, 计算出局部区域点云的曲率信息, 采用局部特征权值和曲率极值法识别特征点。构建特征点的最小生成树生成特征曲线。基于平均曲率的局部特征权值能表达采样点曲面变化形状, 反映尖锐点的特性; 分区求解曲率信息及特征信息, 能减少计算量, 提高时间效率。
2 本文算法
2.1 算法概述
输入点云数据采用聚类优化算法对点云进行区域分割, 将点云划分为包含原始对象特征信息的各个聚类区域; 再对每个分区的点云分别进行RBF曲面重构, 并计算每一分区的曲率信息, 通过设置局部特征权值和筛选曲率极值点来识别区域特征点; 构建特征点的最小生成树, 并进行分割、细化, 提取出特征线。算法简易流程如图1所示。
图1
图1 算法过程图。(a)原始点云; (b)聚类分割结果; (c)特征点识别结果; (d)生成特征线Fig. 1 Overall procedure of the proposed method. (a) Original point cloud; (b) region clustering segmentation result; (c) feature point recognition result; (d) generation of the feature lines
2.2 算法实施步骤
2.2.1 点云区域聚类
基于聚类的区域分割方法是将具有较高相似特征性的数据点进行统计分类的过程, 分割得到的各个区域之间的交线为特征线。采用社会粒子群优化算法(SPSO)与模糊C-均值(FCM)聚类算法的混合方法来实现点云数据的区域划分。SPSO-FCM聚类方法为:1)用SPSO算法对种群进行初始化, 并为每个粒子设置不同的跟随阈值; 2)设置种群中每个粒子当前最优位置和初始种群的最优位置, 更新自由粒子的位置和跟随粒子的速度和位置; 3)采用模糊C-均值聚类算法求解隶属度矩阵, 确定适应值函数, 更新所有粒子的最优位置, 并判断粒子和种群的位置优越性, 得到准确的聚类中心, 实现对点云数据的区域划分。SPSO算法具有较强的全局搜索能力, 可避免FCM聚类算法容易陷入局部收敛的缺陷。SPSO-FCM聚类算法精度高, 而且还有较好的抗噪性, 可实现区域的准确分割, 得到较清晰的区域边界, 有利于边界特征点的提取。SPSO-FCM聚类算法的具体步骤详见文献[
2.2.2 RBF隐式曲面的建立
径向基函数隐式曲面的建立是用来获取点云模型曲率信息。常用的点云曲率估算方法有主成分分析法、移动最小二乘法等, 其中, 主成分分析法对微分属性的估算粗糙且不精确, 而移动最小二乘法计算复杂度较高。因此, 选择基于RBF的曲率估算方法, 主要是通过建立采样点的局部隐式曲面, 并根据微分几何理论计算曲率等微分属性。基于RBF的重构曲面光滑性、连续性较好, 方法自动化程度高, 但重建速度慢。为改善重建速度慢、耗时的问题, 对聚类分割后的每一个分区点云进行局部RBF曲面重构, 此过程所涉及的采样点数较少, 系数矩阵比较简单, 可实现参数的快速求解。
定义点云中任一采样点pi的k邻域为Nk(pi), 采用KD树方法对k邻域进行快速搜索, 构建无组织点云之间的拓扑关系, 对其k邻域内的点进行局部RBF曲面重构。根据经验值, k的取值范围为k∈[9, 30]。选取不同的k值进行实验:当k值较小时, 局部曲面拟合精度较低, 影响曲面重构效果; 当k值较大时, 曲面拟合需要的时间较长, 算法效率降低, 而且搜索时间也受k值影响。因此, 选择k=16。若三维空间中某一聚类区域的n个采样点为{p1, p2, …, pi, …, pn}, 且分别对应约束值{h1, h2, …, hi, …, hn}。如果能构造函数f(r)使得每个点均满足等式f(pi)=hi, 那么方程f(pi)=0就可以表示一个隐式曲面, 则建立隐式曲面方程为
f(r)=∑j=1nωjϕ(r-pj)+P(r)=0,(1)
式中:r为插值约束点, 即构建曲面时通过的任意散乱点; pj为建立曲面所需的采样点; ωj为对应每个采样点的径向基的权值; P(r)为一阶多项式, 对任一点(x, y, z), P(r)=a0+a1x+a2y+a3z; ϕ(r-pj)为径向基函数, 常采用的形式为ϕ(x)= x3。
由给定的n个散乱点确定的约束条件为
f(pi)=∑j=1nωjϕ(pi-pj)+P(pi)=hi,i=1, 2,…,n。(2)
使能量方程取得最小值需要满足下式的正交条件为
∑j=1nωj=∑j=1nωjpjx=∑j=1nωjpjy=∑j=1nωjpjz=0。(3)
由(2)、(3)式可以建立线性方程组为
ϕ11ϕ12…ϕ1n1p1xp1yp1zϕ21ϕ22…ϕ2n1p2xp2yp2z︙︙︙︙︙︙︙ϕn1ϕn2…ϕnn1pnxpnypnz11…100…0p1xp2x…pnx00…0p1yp2y…pny00…0p1zp2z…pnz00…0ω1ω2︙ωna0a1a2a3=h1h2︙hn0000。(4)
解线性方程组(4), 得唯一的一组解(ω1, ω2, …, ωn, a0, a1, a2, a3)。将所得解代入(1)式, 得到该隐式曲面方程为
f(x,y,z)=∑j=1nωj[(x-pjx)2+(y-pjy)2+(z-pjz)2]3+a0+a1x+a2y+a3z。(5)
2.2.3 曲率信息估算
为聚类分割后的每一分区建立隐式曲面f(x, y, z), 根据参数曲面的曲率性质计算其主曲率和主方向, 并将其近似为采样点的曲率值。根据微分几何理论可知, 局部曲面内采样点的高斯曲率K是主曲率的乘积, 平均曲率H是主曲率之和的平均值。K与H符号设置的不同, 可以代表不同的局部曲面类型。若采样点的最大主曲率为k1, 最小主曲率为k2, 相对应的最大主曲率方向为M1, 最小主曲率方向为M2。那么高斯曲率和平均曲率可表示为
K=k1k2,H=k1+k22。(6)
根据平均曲率符号得到采样点的凹凸信息, 并基于平均曲率的方法提取特征点。
2.2.4 特征点识别
为点云中的每一个采样点设置一个特征权值, 使之与采样点隶属于特征点的可能性成正比关系。本文提出利用点云平均曲率来计算点的局部特征权值, 将局部特征权值与设置的阈值相比, 从而检测出局部区域内潜在的特征点。局部特征权值反映了采样点平均曲率的离散程度, 而方差能够反映数据偏离平均数的分布情况, 因此, 可以利用方差定义点云的局部特征权值。对于点云中任一点pi∈P, 其k邻域点集为qi∈Q(i=1, 2, …, k), 已知k邻域点集内点qi处的平均曲率为 Hqi, 则定义采样点在k邻域下的局部特征权值为
ω(qi,k)=1k∑ik(Hqi-V-)2,(7)
式中 V-是k邻域内点的平均曲率的平均值, 即 V-=1k∑ikHqi。
对于∀pi∈P, 若该点k邻域处的局部特征权值满足ω(qi, k)> ωmax, 则认为该点为k邻域下的特征点, 其中ωmax为阈值, 可由用户设定或通过系统自动计算得到。在局部特征权值大的区域, 点的平均曲率的离散性较大, 说明该区域内包含的特征信息量较大, 则该点成为特征点的可能性就越大。因是对k邻域内众多采样点求解局部特征权值, 所以, 局部特征权值对单点噪声不敏感。因此, 采用该方法检测特征点, 可满足算法对高信息量、稳健性和较强抗噪性的要求。
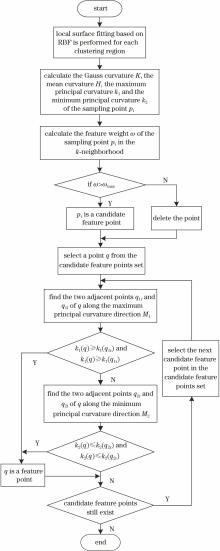
将根据局部特征权值检测出的点作为候选特征点, 沿着候选特征点的最大主曲率方向和最小主曲率方向搜索其曲率极值点, 实际特征点即为候选特征点内的曲率极值点。在候选特征点中任选一点q, 沿最大主曲率方向M1找到其左右两个相邻点q1l和q1r, 如果k1(q)≥k1(q1l)且k1(q)≥k1(q1r), 则q为曲率极值点, 即为检测出的实际特征点, 其中k1(q1l)、k1(q1r)分别为点q1l、q1r沿最大主曲率方向M1上的曲率值。否则, 再沿最小主曲率方向M2找到q点的左右两个相邻点q2l和q2r, 若k2(q)≤k2(q2l)且k2(q)≤k2(q2r), 则q为最小主曲率方向上的极值点, 也可以作为实际特征点。由此, 遍历候选特征点集中的每一个点, 提取出当前集合中曲率极值点作为实际特征点, 则在候选特征点集中删除非曲率极值点。特征点识别流程图如图2所示。
图2
图2 特征点识别流程图Fig. 2 Flow chart of the feature point recognition stage
2.2.5 特征线生成
得到的实际特征点是杂乱无序、不包含任何拓扑信息, 因此还需要通过构建特征曲线的方法对特征点进行连接。特征线生成步骤如下:1)根据采样点的局部特征权值大小, 筛选出特征权值最大的点作为种子点, 建立最小生成树, 构建连通区域; 2)将特征点连接成线; 3)分割、细化细小分支, 得到特征线。
3 实验结果与分析
3.1 不同点云模型的特征提取结果分析
在VS2013和OpenGL开发平台下实现本文特征提取方法, 并在具有CPU Intel Core i5 2.6 GHz处理器和8 G内存的标准PC上对点云模型进行测试, 实验结果如图3~6所示。
图3
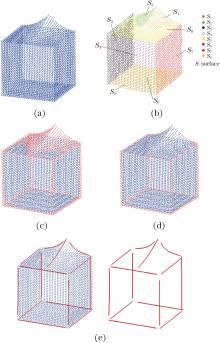
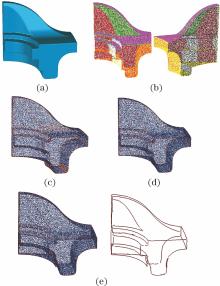
图3 模型1的特征线提取。(a)模型1原始点云; (b)聚类分割结果; (c)候选特征点集; (d)特征点集; (e)特征线提取结果Fig. 3 Feature line extraction from Model 1. (a) Original point cloud of Model 1; (b) region clustering segmentation; (c) set of candidate feature points; (d) set of feature points; (e) feature line extraction results
图4
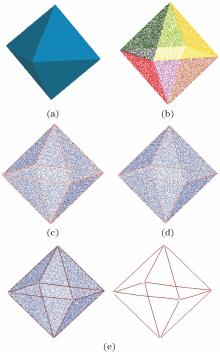
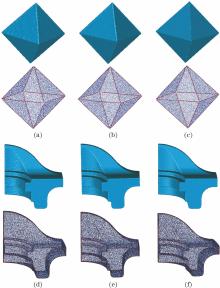
图4 模型2的特征线提取。(a)模型2三角化光照模型; (b)聚类分割结果; (c)候选特征点集; (d)特征点集; (e)特征线提取结果Fig. 4 Feature line extraction from Model 2. (a) Triangulated lighting model of Model 2; (b) region clustering segmentation; (c) set of candidate feature points; (d) set of feature points; (e) feature line extraction results
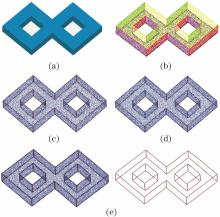
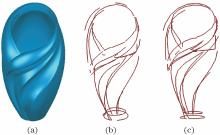
图3为模型1特征线提取过程, 其由5个规则平面和顶部一个不规则曲面构成, 将点云数据聚类后, 为凸显聚类结果, 用不同颜色表示模型分区后的效果, 如图3(b)所示。规则平面为S3~S7, 顶部不规则曲面依据形状特征信息又划分为3个区域, 分别为S1、S2和S8。图3(c)、(d)中的红色点分别为检测出的候选特征点和识别出的真实特征点。模型1中的显著特征主要为直线特征, 在其顶部包含了3条特征强度逐渐减弱的曲线特征。由图3(e)可看出, 模型1的显著特征均得到正确提取, 且尽可能多地提取了曲线特征。图4为模型2的特征线提取过程, 其为八面体点云模型, 特征线为八面体的棱线。图4(a)为模型2经三角化后的光照模型, 能够更清晰地显示模型2的特征; 图4(b)为SPSO-FCM区域分割结果, 每一区域的边界划分清晰。图4(c)、(d)为特征点识别结果; 图4(e)所示模型2的棱线均得到准确提取。图5所示为模型3特征线提取过程。图3~5所示点云模型结构比较规则, 均包含显著特征信息, 且以直线特征信息为主, 模型中的尖锐特征信息也能得到较好识别。
模型4为Fandisk点云模型, 其中既包含尖锐特征, 也包含曲线特征, 且曲线特征的强度是渐变的, 其特征线提取过程如图6所示。将本文方法与
图5
图5 模型3的特征线提取。(a)模型3三角化光照模型; (b)聚类分割结果; (c)候选特征点集; (d)特征点集; (e)特征线提取结果Fig. 5 Feature line extraction from Model 3. (a) Triangulated lighting model of Model 3; (b) region clustering segmentation; (c) set of candidate feature points; (d) set of feature points; (e) feature line extraction results
图6
图6 模型4的特征线提取。(a)模型4三角化光照模型; (b)聚类分割结果; (c)候选特征点集; (d)特征点集; (e)特征线提取结果Fig. 6 Feature line extraction from Model 4. (a) Triangulated lighting model of Model 4; (b) region clustering segmentation; (c) set of candidate feature points; (d) set of feature points; (e) feature line extraction results
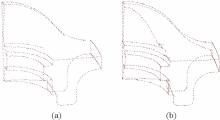
文献[ 表1、2总结了特征提取流程不同阶段的性能数据。
图7
图7 模型4特征提取方法比较。(a)文献[Fig. 7 Comparison of the feature extraction methods used in Model 4. (a) Ref. [13] method; (b) proposed method
图8
图8 模型5特征提取方法比较。(a)模型5三角化光照模型; (b)文献[Fig. 8 Comparison of the feature extraction methods used in Model 5. (a) Triangulated lighting model of Model 5; (b) Ref. [13] method; (c) proposed method
综合上述实验分析可知, 本文方法可以有效提取点云模型的主要特征信息, 并且保证其精度; 特征点识别及特征线生成时间较快, 提高了特征线提取效率。
表1
Table 1
Complexity in different stages
Table 1 表1 不同阶段的点云数目 Table 1 Complexity in different stages
表1不同阶段的点云数目Table 1Complexity in different stagesModelNumber of original point cloudsNumber of candidate feature pointsNumber of feature pointsModel 161771729803
Model 21329429241728
Model 34000087995199
Model 454465130717080
Model 52590159573626
表2
Table 2
Duration of the feature extraction pipeline in seconds
Table 2 表2 特征提取流程中的时间参数 Table 2 Duration of the feature extraction pipeline in seconds
表2特征提取流程中的时间参数Table 2Duration of the feature extraction pipeline in secondsModelCandidate feature point extraction time /sFeature point extraction time /sFeature line generation time /sModel 10.0400.0390.241
Model 20.0900.0990.379
Model 30.3460.2861.763
Model 40.5010.4121.837
Model 50.1900.1640.796
3.2 k邻域尺度变化的敏感性
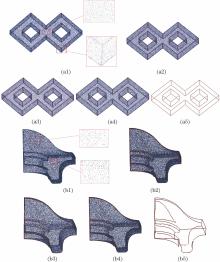
选择k个最邻近点来表示点的邻域, 在特征点提取过程中, 通过对不同邻域尺度(选取不同的k值)下提取的特征点的分析, 证明除k值取过大或过小外, 本文方法对邻域尺度的变化不敏感。由于采样不均匀, 导致不同区域的k邻域尺度不同, 但特征点却是相同的。凭经验k的取值范围可归纳为k∈[9, 30], 设定k=16作为所有最终结果的默认设置。图9所示为模型3和模型4在不同邻域尺度下的特征提取结果, 两者均表现出不同程度的非均匀采集密度。邻域尺度在以下情况下对点云模型具有相当大的影响: 1)给定的点云非常不均匀; 2)受到严重的噪声干扰。
图9
图9 本文方法在不同邻域尺度下的特征线提取效果。(a1)模型3的原始点云及其局部放大细节; (a2) k=10, (a3) k=16, (a4) k=25的提取效果; (a5)模型3特征线; (b1)模型4的原始点云及其局部放大细节; (b2) k=10, (b3) k=16, (b4) k=25的特征线提取效果; (b5)模型4特征线Fig. 9 Feature line extracted by the proposed method using different neighborhood scales. (a1) Original point cloud and its partial enlarged detail in Model 3; extraction effects with (a2) k=10, (a3)k=16, (a4)k=25; (a5) feature line of Model 3; (b1) original point cloud and its partial enlarged detail in Model 4; extraction effects with (b2) k=10, (b3) k=16, (b4) k=25; (b5) feature line of Model 4
3.3 对噪声的稳健性
为验证本文方法对噪声的稳健性, 通过Matlab软件给点云模型2和模型4添加适当的噪声进行实验。模型2中添加的信噪比分别为15 dB, 20 dB和30 dB的高斯白噪声; 模型4中添加的信噪比分别为45 dB, 50 dB和60 dB的高斯白噪声。图10所示为噪声模型的特征提取结果, 由于特征点是通过计算阈值和分析区域信息定义的, 证明强度适中的噪声对点云模型的特征提取结果影响不大。随着噪声强度的增加, 会使某些特征点缺失。模型4中, 在具有尖锐特征的区域中出现大面积的梯度, 随着噪声强度的增加, 导致特征较弱点和边缘点丢失。因此, 特征线重建时无法连接所有特征线, 会出现特征线断裂的情况。
图10
图10 本文方法在不同强度噪声下的特征提取结果。(a)~(c)模型2中分别添加15 dB、20 dB和30 dB的噪声; (d)~(f)模型4中分别添加45 dB、50 dB和60 dB的噪声Fig. 10 Results of the proposed method for noisy datasets. (a)-(c) Add noise of 15 dB, 20 dB and 30 dB in Model 2, respectively; (d)-(f) add noise of 45 dB, 50 dB and 60 dB in Model 4, respectively
4 结论
提出了一种基于区域聚类分割的散乱点云特征线提取方法, 应用聚类算法对点云数据进行区域分割, 得到区域边界清晰的子区域, 再在此基础上分区进行点云特征信息的提取。这样有助于更准确地提取到点云模型的边界特征信息。同时, 聚类算法所具有的良好的抗噪性可以降低对噪声点云特征信息的干扰。在特征点识别过程中, 采用方差定义局部邻域内采样点的特征权值, 并通过局部邻域内的采样点的平均曲率来计算特征权值。采用局部特征权值的方法能更好地提取尖锐特征点和弱特征信息。而在点云的曲率计算和特征提取过程中, 采用局部分析的策略, 可以减少计算量和复杂度, 提高方法运行的效率, 尤其适用于复杂的、特征类型多变的点云模型。
经实验验证, 本文方法在提取到点云模型中显著特征、尖锐特征的同时, 能够尽可能多地提取到强度变化的特征信息。但对于形状复杂、曲线特征信息较多的点云模型, 所提取的特征线仍存在局部断裂或者不完整的情况。下一步研究工作将针对这个问题展开。此外, 特征线的优化也是一个值得研究的方向。
The authors have declared that no competing interests exist.
作者已声明无竞争性利益关系。
参考文献
[1]
Gumhold S, Wang X L, Macleod R. Feature extraction from point clouds [C]∥International Meshing Roundtable, 2001: 293- 305.
[本文引用:1]
[2]
Pauly M, Keiser R, Gross M. Multi-scale feature extraction on point-sampled surfaces[J]. 2003, 22( 3): 281- 289.
Abstract We present a new technique for extracting line-type features on point-sampled geometry. Given an unstructuredpoint cloud as input, our method first applies principal component analysis on local neighborhoods toclassify points according to the likelihood that they belong to a feature. Using hysteresis thresholding, we thencompute a minimum spanning graph as an initial approximation of the feature lines. To smooth out the featureswhile maintaining a close connection to the underlying surface, we use an adaptation of active contour models.Central to our method is a multi-scale classification operator that allows feature analysis at multiplescales, using the size of the local neighborhoods as a discrete scale parameter. This significantly improves thereliability of the detection phase and makes our method more robust in the presence of noise. To illustrate theusefulness of our method, we have implemented a non-photorealistic point renderer to visualize point-sampledsurfaces as line drawings of their extracted feature curves.
[本文引用:1]
[3]
Demarsin K, Vand erstraeten D, Volodine T, et al. Detection of closed sharp edges in point clouds using normal estimation and graph theory[J]. 2007, 39( 4): 276- 283.
The reconstruction of a surface model from a point cloud is an important task in the reverse engineering of industrial parts. We aim at constructing a curve network on the point cloud that will define the border of the various surface patches. In this paper, we present an algorithm to extract closed sharp feature lines, which is necessary to create such a closed curve network. We use a first order segmentation to extract candidate feature points and process them as a graph to recover the sharp feature lines. To this end, a minimum spanning tree is constructed and afterwards a reconnection procedure closes the lines. The algorithm is fast and gives good results for real-world point sets from industrial applications.
[本文引用:1]
[4]
Kim S K. Extraction of ridge and valley lines from unorganized points[J]. 2013, 63( 1): 265- 279.
Given an unstructured point set, we use an MLS (moving least-squares) approximation to estimate the local curvatures and their derivatives at a point by means of an approximating surface. Then, we compute neighbor information using a Delaunay tessellation. Ridge and valley points can then be detected as zero-crossings, and connected using curvature directions. We demonstrate our method on several large point-sampled models, rendered by point-splatting, on which the ridge and valley lines are rendered with line width determined from curvatures.
[本文引用:1]
[5]
Ni H, Lin X G, Ning X G, et al. Edge detection and feature line tracing in 3D-point clouds by analyzing geometric properties of neighborhoods[J]. 2016, 8( 9): 710.
This paper presents an automated and effective method for detecting 3D edges and tracing feature lines from 3D-point clouds. This method is named Analysis of Geometric Properties of Neighborhoods (AGPN), and it includes two main steps: edge detection and feature line tracing. In the edge detection step, AGPN analyzes geometric properties of each query point鈥檚 neighborhood, and then combines RANdom SAmple Consensus (RANSAC) and angular gap metric to detect edges. In the feature line tracing step, feature lines are traced by a hybrid method based on region growing and model fitting in the detected edges. Our approach is experimentally validated on complex man-made objects and large-scale urban scenes with millions of points. Comparative studies with state-of-the-art methods demonstrate that our method obtains a promising, reliable, and high performance in detecting edges and tracing feature lines in 3D-point clouds. Moreover, AGPN is insensitive to the point density of the input data.
[本文引用:1]
[6]
Altantsetseg E, Muraki Y, Matsuyama K, et al. Feature line extraction from unorganized noisy point clouds using truncated Fourier series[J]. 2013, 29( 6/7/8): 617- 626.
AbstractThe detection of feature lines is important for representing and understanding geometric features of 3D models. In this paper, we introduce a new and robust method for extracting feature lines from unorganized point clouds. We use a one-dimensional truncated Fourier series for detecting feature points. Each point and its neighbors are approximated along the principal directions by using the truncated Fourier series, and the curvature of the point is computed from the approximated curves. The Fourier coefficients are computed by Fast Fourier Transform (FFT). We apply low-pass filtering to remove noise and to compute the curvature of the point robustly. For extracting feature points from the detected potential feature points, the potential feature points are thinned using a curvature weighted Laplacian-like smoothing method. The feature lines are constructed through growing extracted points and then projected onto the original point cloud. The efficiency and robustness of our approach is illustrated by several experimental results.
[本文引用:1]
[7]
Nie J H, Liu Y, Gao H, et al. Feature line detection from point cloud based on signed surface variation and region segmentation[J]. Journal of Computer-Aided Design & Computer Graphics, 2015, 27( 12): 2332- 2339.聂建辉, 刘烨, 高浩, 等. 基于符号曲面变化度与特征分区的点云特征线提取算法[J]. 2015, 27( 12): 2332- 2339.
特征线对三维模型的表达和识别具有重要意义,提出了符号曲面变化度的概念,其具备同时表达曲面弯曲程度和凹凸类型的能力,可以作为曲面曲率的良好近似.在此基础上,提出了一种基于符号曲面变化度与特征分区的特征线提取算法.首先选取点云中符号曲面变化度绝对值大于一定阈值的点作为潜在特征点;然后将符号曲面变化度作为区域增长限定条件对潜在特征点进行分割,并在通过局部曲面重建确定区域边界点后,采用基于曲面变化度和距离加权的双边滤波算法迭代细化边界点,以确定特征点真实位置;最后通过建立特征点的最小生成树实现特征线连接.实验结果表明,该算法能很好地识别、分割点云中的特征点,提取到准确、完整的特征线.
[本文引用:1]
[8]
Park M K, Lee S J, Lee K H. Multi-scale tensor voting for feature extraction from unstructured point clouds[J]. 2012, 74( 4): 197- 208.
Identifying sharp features in a 3D model is essential for shape analysis, matching and a wide range of geometry processing applications. This paper presents a new method based on the tensor voting theory to extract sharp features from an unstructured point cloud which may contain random noise, outliers and artifacts. Our method first takes the voting tensors at every point using the corresponding neighborhoods and computes the feature weight to infer the local structure via eigenvalue analysis of the tensor. The optimal scale for a point is automatically determined by observing the feature weight variation in order to deal with both a noisy smooth region and a sharp edge. We finally extract the points at sharp features using adaptive thresholding of the feature weight and the feature completion process. The multi-scale tensor voting of a given point set improves noise sensitivity and scale dependency of an input model. We demonstrate the strength of the proposed method in terms of efficiency and robustness by comparing it with other feature detection algorithms.
[本文引用:1]
[9]
Liu X S, Jin C N. Feature line extraction from unorganized noisy point clouds[J]. Journal of Computational Information Systems, 2014, 10( 8): 3503- 3510.
[本文引用:1]
[10]
Zhang Y H, Geng G H, Wei X R, et al. A statistical approach for extraction of feature lines from point clouds[J]. 2016, 56: 31- 45.
61Presence of a statistical approach based on Poisson distribution computing different thresholds for different local features.61Goes beyond user-setting feature measure threshold of previous feature extraction methods.61Enables line reconstruction based on geometry of feature points and link information.
[本文引用:1]
[11]
Li M L, Zong W P, Li G Y, et al. Extraction of structure line segments from point clouds using voxel-based region growing[J]. Acta Optica Sinica, 2018, 38( 1): 0112001.李明磊, 宗文鹏, 李广云, 等. 基于体素生长的点云结构直线段提取[J]. 2018, 38( 1): 0112001.
针对现有结构直线段提取方法存在的效率低下或准确程度不足等问题, 提出了一种基于体素生长的点云结构直线段高效提取方法。首先, 对点云进行体素化剖分与平面分割, 并以体素为单位进行邻域判断, 实现对结构直线段分布区域的筛选; 然后, 采用基于体素的区域生长对结构直线段的分布区域进行分割; 最后, 依据结构线段分布区域的范围以及其所在平面的数学方程实现其提取和优化, 并进行精度评定。进行了实验测试, 利用多组点云数据验证了本方法的有效性, 利用对比实验验证了本方法的精度和高效性。实验结果显示: 相比现有方法, 该方法在效率上提高了10倍以上, 在精度上提高了0.25倍左右, 证明提出的方法可以准确高效地得到较为理想的点云结构直线段提取结果。
[本文引用:1]
[12]
Zhang A W, Xiao T, Duan Y H. A method of adaptive feature selection for airborne LiDAR point cloud classification[J]. Laser & Optoelectronics Progress, 2016, 53( 8): 082802.张爱武, 肖涛, 段乙好. 一种机载LiDAR点云分类的自适应特征选择方法[J]. 2016, 53( 8): 082802.
不同地形条件下,不同的特征组合、特征维数对点云的分类效率及分类结果有不同的影响。提出了一种机载LiDAR点云分类的自适应特征选择方法,该方法依据地形起伏情况对整体点云数据进行区域划分,自适应选择适宜该区域LiDAR点云分类的特征集合。为了验证这种特征选择方法的有效性,利用优选后的特征集合,分别采用随机森林和支持向量机算法进行分类实验验证,实验结果表明,在不同地形条件的区域里,适合LiDAR点云分类的特征集合不同。该方法可以有效地降低特征维数,缩短运算时间,且分类精度较高。
[本文引用:1]
[13]
Weber C, Hahmann S, Hagen H. Sharp feature detection in point clouds [C]∥IEEE International Conference on Shape Modeling and Applications, 2010: 175- 186.
[本文引用:4]
[14]
Xu J Y, Zhou M Q, Wu Z K, et al. Robust surface segmentation and edge feature lines extraction from fractured fragments of relics[J]. 2015, 2( 2): 79- 87.
Surface segmentation and edge feature lines extraction from fractured fragments of relics are essential steps for computer assisted restoration of fragmented relics. As these fragments were heavily eroded, it is a challenging work to segment surface and extract edge feature lines. This paper presents a novel method to segment surface and extract edge feature lines from triangular meshes of irregular fractured fragments. Firstly, a rough surface segmentation is accomplished by using a clustering algorithm based on the vertex normal vector. Secondly, in order to differentiate between original and fracture faces, a novel integral invariant is introduced to compute the surface roughness. Thirdly, an accurate surface segmentation is implemented by merging faces based on face normal vector and roughness. Finally, edge feature lines are extracted based on the surface segmentation. Some experiments are made and analyzed, and the results show that our method can achieve surface segmentation and edge extraction effectively.
[本文引用:1]
[15]
Bazazian D, Casas J R, Ruiz-Hidalgo J. Segmentation-based multi-scale edge extraction to measure the persistence of features in unorganized point clouds [C]∥International Joint Conference on Computer Vision, Imaging and Computer Graphics Theory and Applications, 2017: 317- 325.
[本文引用:1]
[16]
Wang X H, Wu L S, Chen H W, et al. Particle swarm optimization fuzzy clustering[J]. Optics and Precision Engineering, 2017, 25( 4): 1095- 1105.王晓辉, 吴禄慎, 陈华伟, 等. 应用改进的粒子群优化模糊聚类实现点云数据的区域分割[J]. 2017, 25( 4): 1095- 1105.
为实现点云数据的区域划分,提出一种基于改进的粒子群优化与模糊C-均值聚类的混合算法(SPSO-FCM算法).针对在点云聚类过程中易过早捕获局部极小值的问题,算法首先用改进的粒子群算法——社会粒子群优化算法,对种群进行初始化,通过为每一个粒子设置不同的跟随阈值,来维护种群中个体多样性,加深对种群全局搜索的程度,避免陷入局部极小值;随后,设置种群中每个粒子当前最优位置和初始种群的最优位置,更新自由粒子的位置和跟随粒子的速度和位置;最后,采用模糊C-均值聚类算法求解隶属度矩阵,确定适应值函数,更新所有粒子的最优位置,并判断粒子和种群的位置优越性,得到准确的聚类中心,实现对点云数据的区域划分.以曲面复杂度不一致的点云模型为例对算法进行验证,探讨SPSO-FCM聚类算法的可行性,并与FCM聚类算法、遗传FCM聚类算法进行比对.实验结果显示,SPSO-FCM聚类算法较其它两种算法,收敛速度快,迭代次数少,聚类准确,边界区域分割清晰,特别是对型面复杂、点云数据较多的机械零部件点云数据进行分割时,能得到更好的分割结果.
[本文引用:1]
1
2001
0.0
0.0
... Gumhold等[1]通过计算邻域图建立局部点云之间的连接信息,并用主成分分析法确定特征点,但对曲面凹凸性差别小的谷脊特征提取效果较差 ...
1
2003
0.0
0.0
... Pauly等[2]在前述方法的基础上引入多尺度分析,通过分析局部邻域内的点成为特征点的可能性,以此来识别特征点,这种方法更为稳健抗噪 ...
1
2007
0.0
0.0
... Demarsin等[3]提出了一种基于图论的点云特征线提取算法 ...
1
2013
0.0
0.0
... Kim等[4]使用近似移动最小二乘法,通过逼近曲面来估计曲率及其导数,然后,利用Delaunay三角剖分来计算邻域信息,从而提取谷脊点 ...
1
2016
0.0
0.0
... Ni等[5]提出了一种邻域几何属性分析方法(AGPN),用于检测点云的三维边缘和跟踪特征线 ...
1
2013
0.0
0.0
... Altantsetseg等[6]使用截取的傅里叶级数检测点云中的特征点,并使用曲率加权拉普拉斯算子平滑方法稀疏潜在特征点,再通过增加提取点来构造特征线,并投影到原始点云上 ...
1
2015
0.0
0.0
... 聂建辉等[7]将符号曲面变化度与特征区域分割相结合,为点云数据提供了一种有效的特征线提取方法 ...
1
2012
0.0
0.0
... Park等[8]提出了一种基于张量投票理论的新方法,可从包含随机噪声、孤立点和伪影的非结构化点云中提取尖锐特征,且对噪声起到了很好的抵制作用 ...
1
2014
0.0
0.0
... Liu等[9]使用多尺度算子,即法线的差来检测潜在特征线附近的特征点 ...
1
2016
0.0
0.0
... Zhang等[10]将基于泊松分布的统计模型作为一种工具用于从点云中提取特征点 ...
1
2018
0.0
0.0
... 李明磊等[11]提出了一种基于体素生长的点云结构直线段提取方法,以体素为单位进行邻域判断,并采用基于体素的区域生长对结构直线段的分布区域进行分割,根据分布区域的范围及其所在平面的数学方程实现对特征的提取和优化 ...
1
2016
0.0
0.0
... 张爱武等[12]提出了一种机载LiDAR点云分类的自适应特征选择方法,其依据地形起伏情况对整体点云数据进行区域划分,自适应选择适宜该区域LiDAR点云分类的特征集合 ...
4
2010
0.0
0.0
... Weber等[13]提出了一种使用高斯映射聚类进行特征检测的技术,利用高斯映射聚类对局部邻域上当前点组成的三角形的法向进行聚类,依据聚类个数判别特征点 ...
... 文献[ 13]提出的基于高斯法向聚类的特征提取方法进行比较,得到如图7所示的实验对比结果 ...
... 结果显示,文献[ 13]方法可以提取Fandisk模型上的直线特征和曲线特征,但对于扇形区域的特征信息,没有很好的保留,未识别出部分特征强度逐渐减弱的曲线特征 ...
... 图7(b)中,本文方法提取结果明显优于文献[ 13]方法 ...
1
2015
0.0
0.0
... Xu等[14]研究了一种分割曲面和从不规则断裂碎片的三角网格中提取边缘特征线的新方法,通过使用基于顶点法向量的聚类算法来完成粗糙表面分割 ...
1
2017
0.0
0.0
... Bazazian等[15]提出一种基于分割的多尺度边缘提取技术 ...
1
2017
0.0
0.0
... SPSO-FCM聚类算法的具体步骤详见文献[ 16] ...

