基于30系显卡以及Ubuntu18.04系统的YOLOv3环境搭建和训练模型以及测试
基于30系显卡以及Ubuntu18.04系统的YOLOv3环境搭建和训练模型以及测试
安装环境
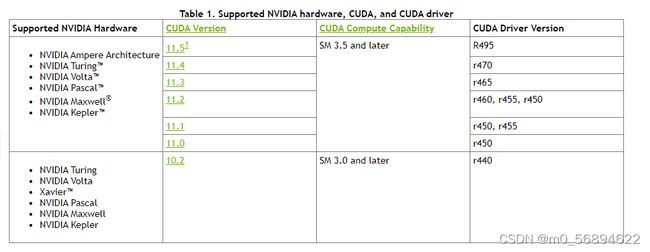
下面是官网对N卡框架以及驱动和cuda版本的部分对应关系
驱动
(可以跳过这段安装,你可以在安装CUDA的时候,他会自动推荐版本)
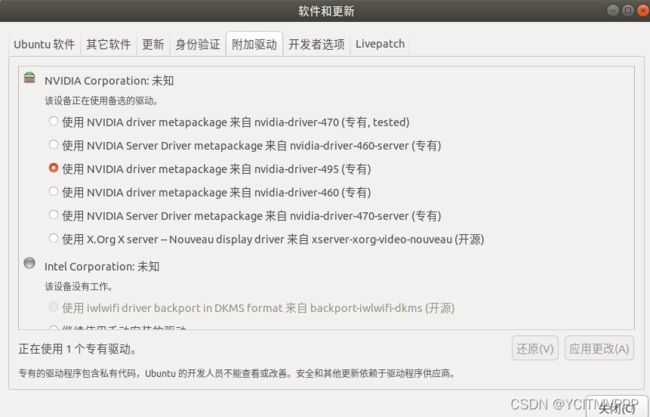
最简单直接 的办法就是进入软件和更新 进入附加驱动选择驱动安装
#查看自己可以装的显卡驱动
nvidia-smi
#也可以执行以下命令,安装推荐的nvidia驱动版本————————这是第二种,大家可以选择
sudo ubuntu-drivers autoinstall
cuda(显卡30系不兼容11版本以下)
安装之前先看看自己驱动和cuda版本对应(这个是最基础的,很重要!!!)
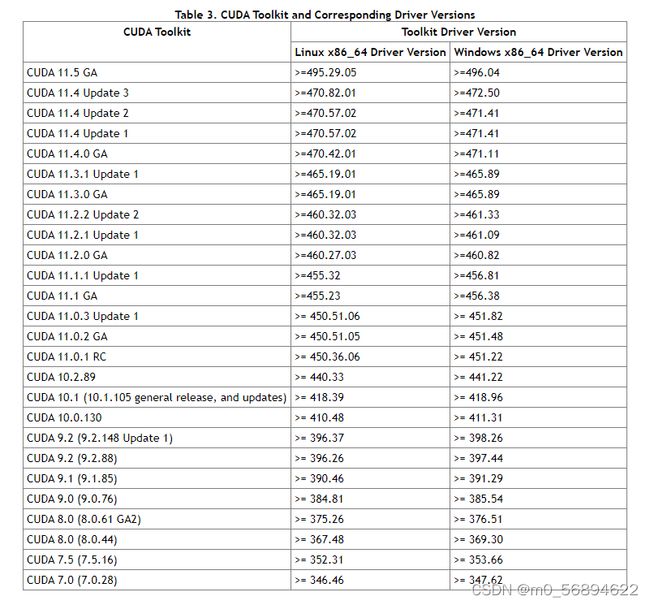
我自己的是cuda11.5和N卡驱动495。(你可以参考一下)
>>>>>cuda下载官网<<<<<
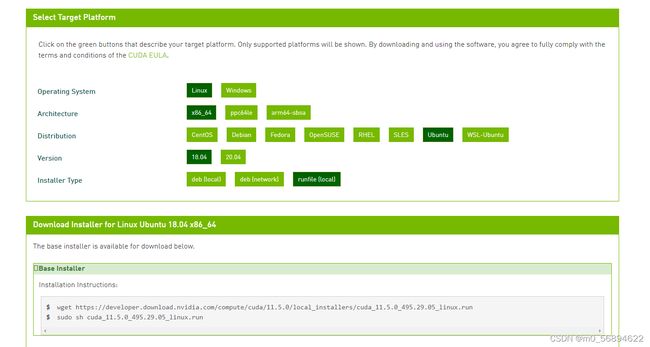 在官网上选择好版本选择runfile 在终端执行第一条语句
下载完成后,到下载文件所在路径执行第二条语句
然后一直enter…
因为之前安装过驱动,所以安装cuda时候要把驱动安装取消
在终端检测cuda是否安装成功:nvcc -V
出现cuda版本就表示成功了
cudnn
NVIDIA cudnn是用于深度神经网络的GPU加速库。它强调性能、易用性和低内存开销。NVIDIA cuDNN可以集成到更高级别的机器学习框架中简单的插入式设计可以让开发人员专注于设计和实现神经网络模型,而不是简单调整性能,同时还可以在GPU上实现高性能现代并行计算。
cuDNN是基于CUDA的深度学习GPU加速库,有了它才能在GPU上完成深度学习的计算。想要在CUDA上运行深度神经网络,就要安装cuDNN,这样才能使GPU进行深度神经网络的工作,工作速度相较CPU快很多。
CUDNN不会对CUDA造成影响
装了cudnn的cuda会比没有cudnn的cuda快上50%左右
anaconda环境
创建pytorch环境
opencv
pip
conda
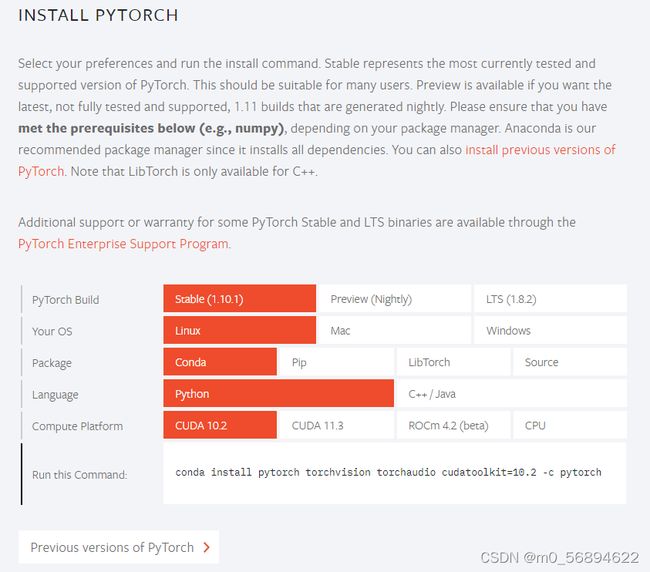
pytorch(要求cuda和显卡驱动的版本严格对应)
下面是官网安装(附上:pytorch官网)
如果版本不对应,可以选择更多版本:
https://pytorch.org/get-started/previous-versions/
进入pytorch环境,输入官网提供的指令
训练
收集照片
爬虫
上网自己学一学,自己搞一搞。
脚本我就不附上了。
拍照(多角度拍照)-------可根据比赛需要进行单一训练(效率更高,弊端是只能用于比赛)
脚本附上:
# _*_coding:utf-8_*_
import cv2
import time
if __name__ == '__main__':
    i = 0
    cap = cv2.VideoCapture(0)
    while (1):
        ret, frame = cap.read()
        cv2.imshow("capture", frame)
        k = cv2.waitKey(0)
        if k == ord('s'):
            cv2.imwrite('路径'(举个栗子 :'D:/data/') + str(i) + '.jpg', frame)
            i += 1
        elif k == ord("q"):
            break
    cap.release()
    cv2.destroyAllWindows()
标注数据集
labelimg(windows更加简单)
处理数据集(脚本)
修改cfg文件或者其他必要文件
voc.names
voc.data
yolov3-tiny.cfg
训练预训练模型
改参数
训练模型(菜就多练)
检测
图片检测
c
python
coco.names(可以不修改)
实时检测
c
python
参数
锚点
batch=8的倍数
subdivisions=8的倍数
卷积层=3*(1+4+类别数)
画出loss和IOU的图像,并且进行比较,找出loss低和IOU接近1的组别。
格式化log文件:
创建log.py文件
# coding=utf-8
import inspect
import os
import random
import sys


def extract_log(log_file, new_log_file, key_word):
    with open(log_file, 'r') as f:
        with open(new_log_file, 'w') as train_log:
            for line in f:
                # 去除多GPU的同步log;去除除零错误的log
                if ('Syncing' in line) or ('nan' in line):
                    continue
                if key_word in line:
                    train_log.write(line)
    f.close()
    train_log.close()
extract_log('训练数据文件', '损失数据', 'images')
extract_log('训练数据文件', '交并比数据', 'IOU')
iou画图:
创建iou.py文件
import pandas as pd
import numpy as np
import matplotlib.pyplot as plt

# 根据log_iou修改行数
lines = 333925
step = 5000
start_ite = 0
end_ite = 50200
igore = 1000
data_path = 'person_train_iou2.txt'  # log_loss的路径。
result_path = '/home/lx/Region Avg IOU2'  # 保存结果的路径。

names = ['Region Avg IOU', 'Class', 'Obj', 'No Obj', '.5_Recall', '.7_Recall', 'count']
# result = pd.read_csv('log_iou.txt', skiprows=[x for x in range(lines) if (x%10==0 or x%10==9)]\
result = pd.read_csv(data_path, skiprows=[x for x in range(lines) if
                                          (x < lines * 1.0 / ((end_ite - start_ite) * 1.0) * igore or x % step != 0)] \
                     , error_bad_lines=False, names=names)
result.head()

for name in names:
    result[name] = result[name].str.split(': ').str.get(1)
result.head()
result.tail()
for name in names:
    result[name] = pd.to_numeric(result[name])
result.dtypes

####--------------
x_num = len(result['Region Avg IOU'].values)
tmp = (end_ite - start_ite - igore) / (x_num * 1.0)
x = []
for i in range(x_num):
    x.append(i * tmp + start_ite + igore)
# print(x)
print('total = %d\n' % x_num)
print('start = %d, end = %d\n' % (x[0], x[-1]))
####-------------


fig = plt.figure()
ax = fig.add_subplot(1, 1, 1)
ax.plot(x, result['Region Avg IOU'].values, label='Region Avg IOU')
# ax.plot(result['Avg Recall'].values, label='Avg Recall')
plt.grid()
ax.legend(loc='best')
ax.set_title('The Region Avg IOU curves')
ax.set_xlabel('batches')
fig.savefig(result_path)
loss画图:
创建loss.py文件
import pandas as pd
import numpy as np
import matplotlib.pyplot as plt

# 根据自己的log_loss.txt中的行数修改lines, 修改训练时的迭代起始次数(start_ite)和结束次数(end_ite)。
lines = 32925
start_ite = 32  # log_loss.txt里面的最小迭代次数
end_ite = 50000  # log_loss.txt里面的最大迭代次数
step = 1000 # 跳行数,决定画图的稠密程度
igore = 1000 # 当开始的loss较大时,你需要忽略前igore次迭代,注意这里是迭代次数

y_ticks = [0.1,0.2,0.3,0.4, 0.5, 0.6, 0.7, 0.8, 0.9, 1.0, 1.1, 1.2, 1.3, 1.4]  # 纵坐标的值,可以自己设置。
data_path = 'person_train_loss3.txt'  # log_loss的路径。
result_path = '/home/lx/loss2'  # 保存结果的路径。

names = ['loss', 'avg', 'rate', 'seconds', 'images']
result = pd.read_csv(data_path, skiprows=[x for x in range(lines) if
                                          (x < lines * 1.0 / ((end_ite - start_ite) * 1.0) * igore or x % step != 9)],
                     error_bad_lines= \
                         False, names=names)
result.head()
for name in names:
    result[name] = result[name].str.split(' ').str.get(1)

result.head()
result.tail()

for name in names:
    result[name] = pd.to_numeric(result[name])
result.dtypes
print(result['avg'].values)

fig = plt.figure()
ax = fig.add_subplot(1, 1, 1)

x_num = len(result['avg'].values)
tmp = (end_ite - start_ite - igore) / (x_num * 1.0)
x = []
for i in range(x_num):
    x.append(i * tmp + start_ite + igore)

print('total = %d\n' % x_num)
print('start = %d, end = %d\n' % (x[0], x[-1]))

ax.plot(x, result['avg'].values, label='avg_loss')
plt.yticks(y_ticks)
plt.grid()
ax.legend(loc='best')
ax.set_title('The loss curves')
ax.set_xlabel('batches')
fig.savefig(result_path)
因为yolov3不会自己选择最好的权重文件,所以可以把训练结果可视化,相互比较,选择最优的权重文件!!!