paddlepaddle:python实现svm鸢尾花分类
元学习论文总结||小样本学习论文总结
2017-2019年计算机视觉顶会文章收录 AAAI2017-2019 CVPR2017-2019 ECCV2018 ICCV2017-2019 ICLR2017-2019 NIPS2017-2019
一.源码链接:paddlepaddle:svm_iris
二.源码
import numpy as np
from matplotlib import colors
from sklearn import svm
from sklearn.svm import SVC
from sklearn import model_selection
import matplotlib.pyplot as plt
import matplotlib as mpl
def load_data():
# 导入数据
data = np.loadtxt('/home/aistudio/data/data2301/iris.data',dtype=float,delimiter=',',converters={4:iris_type})
return data
def iris_type(s):
# 数据转为整型,数据集标签类别由string转为int
it = {b'Iris-setosa':0, b'Iris-versicolor':1, b'Iris-virginica':2}
return it[s]
def classifier():
# 定义分类器
clf = svm.SVC(C=0.5, #误差项惩罚系数
kernel='linear', # 线性核 kenrel="rbf":高斯核
decision_function_shape='ovr') #决策函数
return clf
def train(clf,x_train,y_train):
# x_train:训练数据集
# y_train:训练数据集标签
# 训练开始
clf.fit(x_train,y_train.ravel()) # numpy.ravel同flatten将矩阵拉平
def show_accuracy(a,b,tip):
acc = a.ravel() == b.ravel()
print('%s Accuracy:%.3f' % (tip,np.mean(acc)))
def print_accuracy(clf,x_train,y_train,x_test,y_test):
print('training prediction:%.3f' %(clf.score(x_train, y_train)))
print('test data prediction:%.3f' %(clf.score(x_test, y_test)))
show_accuracy( clf.predict(x_train), y_train, 'traing data')
show_accuracy(clf.predict(x_test), y_test, 'testing data')
def draw(clf,x): # 写完一个函数要运行,否则报错:函数未定义
iris_feature = 'sepal length', 'sepal width', 'petal lenght', 'petal width'
x1_min, x1_max = x[:, 0].min(), x[:, 0].max() #第0列的范围
x2_min, x2_max = x[:, 1].min(), x[:, 1].max() #第1列的范围
x1, x2 = np.mgrid[x1_min:x1_max:200j, x2_min:x2_max:200j] # 生成网格采样点
grid_test = np.stack((x1.flat, x2.flat), axis=1) # 测试点
print('grid_test:\n', grid_test)
z = clf.decision_function(grid_test)
print('the distance to decision plane:\n', z)
grid_hat = clf.predict(grid_test) # 预测分类值 得到【0,0.。。。2,2,2】
print('grid_hat:\n', grid_hat)
grid_hat = grid_hat.reshape(x1.shape) # reshape grid_hat和x1形状一致
#若3*3矩阵e,则e.shape()为3*3,表示3行3列
cm_light = mpl.colors.ListedColormap(['#A0FFA0', '#FFA0A0', '#A0A0FF'])
cm_dark = mpl.colors.ListedColormap(['g', 'b', 'r'])
plt.pcolormesh(x1, x2, grid_hat, cmap=cm_light) #pcolormesh(x,y,z,cmap)这里参数代入
#x1,x2,grid_hat,cmap=cm_light绘制的是背景。
plt.scatter(x[:, 0], x[:, 1], c=np.squeeze(y), edgecolor='k', s=50, cmap=cm_dark)# 样本点
plt.scatter(x_test[:, 0], x_test[:, 1], s=120, facecolor='none', zorder=10) # 测试点
plt.xlabel(iris_feature[0], fontsize=20)
plt.ylabel(iris_feature[1], fontsize=20)
plt.xlim(x1_min, x1_max)
plt.ylim(x2_min, x2_max)
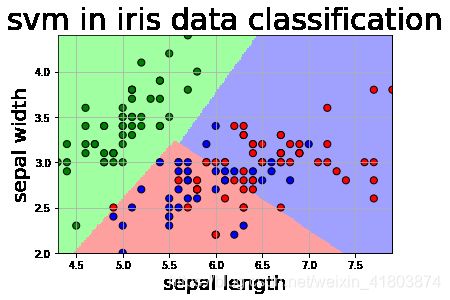
plt.title('svm in iris data classification', fontsize=30)
plt.grid()
plt.show()
# 训练四个特征:
data = load_data()
x,y = np.split(data,(4,),axis=1) # x为前四列,y为第五列,x为训练数据,y为数据标签
# data=(150,5),x=(150,4),y=(150,1)
# x_train,x_test,y_train,y_test = 训练数据,测试数据,训练数据标签,测试数据标签
x_train,x_test,y_train,y_test=model_selection.train_test_split(x,y,random_state=1,test_size=0.3) # 数据集划分成70%30%测试集
clf = classifier() # 声明svm分类器对象
train(clf,x_train,y_train) # 启动分类器进行模型训练
print_accuracy(clf,x_train,y_train,x_test,y_test)
# 训练两个特征(用于画图展示)
#data = load_data()
#print(np.shape(data))
#x,y = np.split(data,(4,),axis=1) # x为前四列,y为第五列,x为训练数据,y为数据标签
#print(np.shape(x))
#print(np.shape(y))
#x=x[:,:2] # 只要前两个特征,此时只训练前两个特征,用于画图
#print(np.shape(x))
#x_train,x_test,y_train,y_test=model_selection.train_test_split(x,y,random_state=1,test_s#ize=0.3)
#clf = classifier()
#train(clf,x_train,y_train)
#print_accuracy(clf,x_train,y_train,x_test,y_test)
#draw(clf,x)
三.运行结果
(150, 4)
(150, 2)
training prediction:0.819
test data prediction:0.778
traing data Accuracy:0.819
testing data Accuracy:0.778
grid_test:
 [[4.3       2.       ]
 [4.3       2.0120603]
 [4.3       2.0241206]
 ...
 [7.9       4.3758794]
 [7.9       4.3879397]
 [7.9       4.4      ]]
the distance to decision plane:
 [[ 2.04663576  1.0980928  -0.14472856]
 [ 2.04808477  1.09663836 -0.14472313]
 [ 2.04953377  1.09518392 -0.1447177 ]
 ...
 [-0.21454554  0.96016146  2.25438408]
 [-0.21309653  0.95870702  2.25438951]
 [-0.21164753  0.95725258  2.25439495]]
grid_hat:
 [0. 0. 0. ... 2. 2. 2.]