逻辑回归之线性可分
文章目录
-
-
-
-
- 公式推导
-
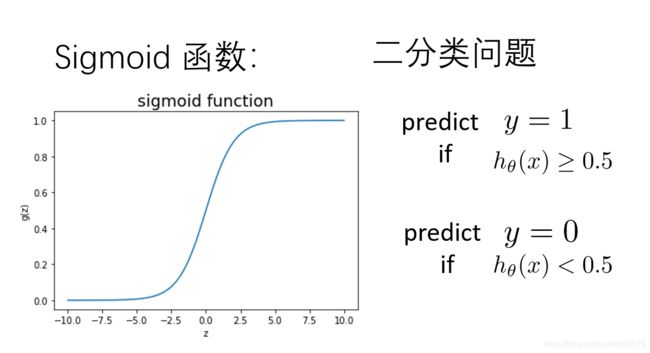
- 1.Sigmoid函数
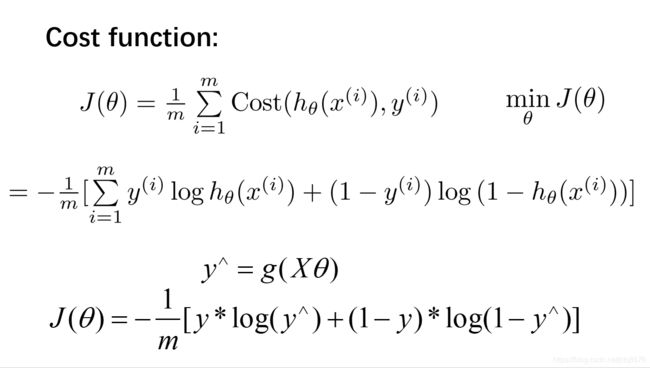
- 2.损失函数
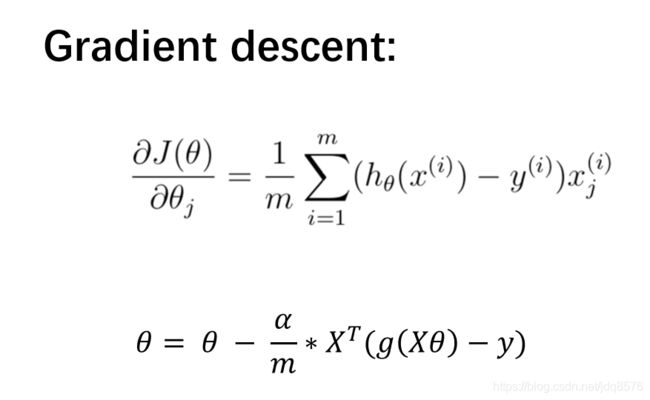
- 3. 梯度下降函数
- 代码实现
-
-
-
逻辑回归-线性不可分案例
案例:设想你是工厂的生产主管,你要决定是否芯片要被接受或抛弃
数据集:ex2data2.txt,芯片在两次测试中的测试结果
公式推导
站在巨人的肩膀上
1.Sigmoid函数
2.损失函数
3. 梯度下降函数
代码实现
import numpy as np
import pandas as pd
import matplotlib.pyplot as plt

path = 'ex2data1.txt'
data = pd.read_csv(path, names=['Exam1', 'Exam2', 'Accepted'])

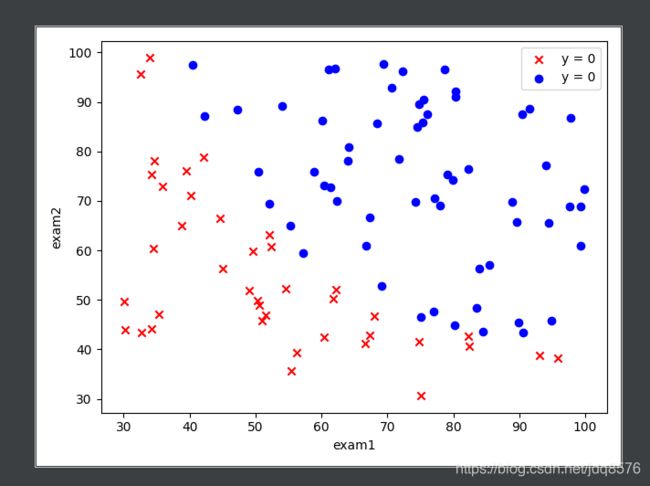
fig, ax = plt.subplots()

ax.scatter(data[data['Accepted'] == 0]['Exam1'], data[data['Accepted'] == 0]['Exam2'], c='r',
           marker='x', label='y = 0')

ax.scatter(data[data['Accepted'] == 1]['Exam1'], data[data['Accepted'] == 1]['Exam2'], c='b',
           marker='o', label='y = 0')

ax.legend()
ax.set(xlabel='exam1', ylabel='exam2')

plt.show()


def get_Xy(data):
    '''
    处理原始数据,变成我们想要的
    :param data:前期从文件中读取的data数据
    :return: 返回特征矩阵和标签矩阵
    '''
    data.insert(0, 'ones', 1)
    X_ = data.iloc[:, 0:-1]
    X = X_.values

    y_ = data.iloc[:, -1]
    y = y_.values.reshape(len(y_), 1)
    return X, y


X, y = get_Xy(data)


def sigmoid(z):
    """
    实现sigmoid函数
    :param z:
    :return:
    """
    return 1 / (1 + np.exp(-z))


def costFunction(X, y, theta):
    """
    损失函数
    :param X:特征值
    :param y: 标签值
    :param theta: 参数
    :return:
    """
    A = sigmoid(X.dot(theta))
    first = y * np.log(A)
    second = (1 - y) * np.log(1 - A)
    return -np.sum(first + second) / len(X)


# 生产原始参数
theta = np.zeros((3, 1))


def gradientDescent(X, y, theta, iters, alpha):
    m = len(X)
    costs = []
    for i in range(iters):
        A = sigmoid(X.dot(theta))
        theta = theta - alpha / m * X.T.dot(A - y)
        cost = costFunction(X, y, theta)
        costs.append(cost)
        if i % 1000 == 0:
            print(cost)
    return costs, theta


# 步长
alpha = 0.004

# 迭代次数
iters = 200000

# 梯度下降法拟合参数theta,并求出损失函数的值
costs, theta_final = gradientDescent(X, y, theta, iters, alpha)

print(theta_final)

'''Output值
[[-23.77361748]
 [  0.18688137]
 [  0.18042754]]
'''


def predict(X, theta):
    """
    根据我们拟合出的theta值去预判y的值,并返回
    :param X: 特征矩阵
    :param theta: 拟合参数theta
    :return: 返回根据拟合参数进行预判的y值
    """
    prob = sigmoid(X.dot(theta))
    return [1 if x >= 0.5 else 0 for x in prob]


y_ = np.array(predict(X, theta_final))

y_pre = y_.reshape(len(y_), 1)

acc = np.mean(y == y_pre)

print(acc) # 0.86

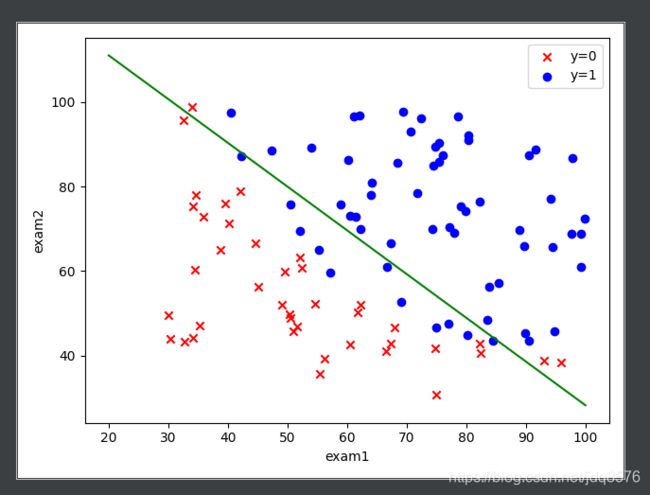
# 画出拟合直线

coef1 = - theta_final[0, 0] / theta_final[2, 0]
coef2 = - theta_final[1, 0] / theta_final[2, 0]

x = np.linspace(20, 100, 100)
f = coef1 + coef2 * x

fig, ax = plt.subplots()

ax.scatter(data[data['Accepted'] == 0]['Exam1'], data[data['Accepted'] == 0]['Exam2'], c='r', marker='x', label='y=0')
ax.scatter(data[data['Accepted'] == 1]['Exam1'], data[data['Accepted'] == 1]['Exam2'], c='b', marker='o', label='y=1')
ax.legend()
ax.set(xlabel='exam1',
       ylabel='exam2')
ax.plot(x, f, c='g')
plt.show()
