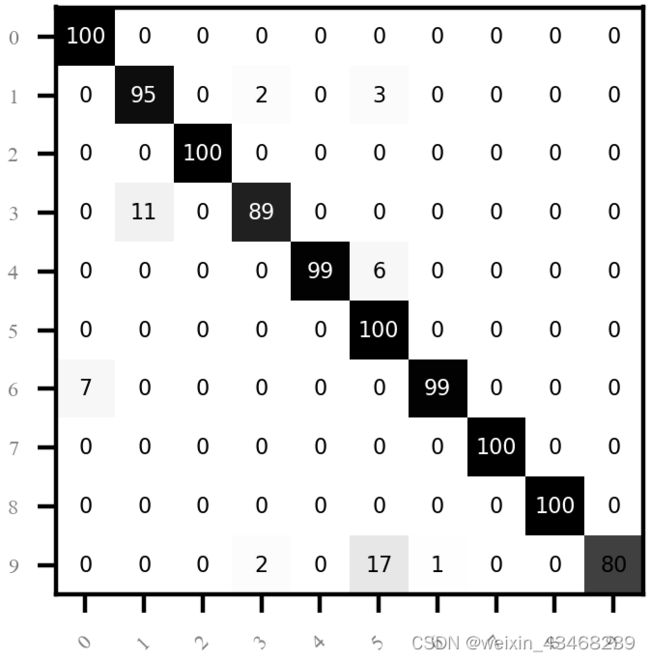
论文里的都是灰白的混淆矩阵,一共十个类。图的边框太粗了,有点丑,但不知道怎么改。
#confusion_matrix
import numpy as np
import matplotlib.pyplot as plt
cm_test = np.array([[100, 0, 0,	0,	0,	0,	0,	0,	0,	0],
                    [0,	95,	0,	2,	0,	3,	0,	0,	0,	0],
                    [0,	0,	100,	0,	0,	0,	0,	0,	0,	0],
                    [0,	11,	0,	89,	0,	0,	0,	0,	0,	0],
                    [0,	0,	0,	0,	99,	6,	0,	0,	0,	0],
                    [0,	0,	0,	0,	0,	100,	0,	0,	0,	0],
                    [7,	0,	0,	0,	0,	0,	99,	0,	0,	0],
                    [0,	0,	0,	0,	0,	0,	0,	100,	0,	0],
                    [0,	0,	0,	0,	0,	0,	0,	0,	100,	0],
                    [0,	0,	0,	2,	0,	17,	1,	0,	0,	80]])
# cm_test = np.array([[2692,20],[30,707]])

classes = ['0','1','2','3','4','5','6','7','8','9']
# 关于类别顺序可由 labels参数控制调整,
# 例如 labels=[2,1,0],则类别将以这个顺序自上向下排列。默认数字类别是从小到大排列,英文类别是按首字母顺序排列
confusion_matrix = cm_test
f=plt.figure(figsize=(3, 2),dpi=400)

tick_marks = np.arange(len(classes))
plt.xticks(tick_marks, classes,size = 4,family='Times New Roman', color='grey',rotation=45) #x轴字体倾斜45度
plt.yticks(tick_marks, classes,size = 4,family='Times New Roman', color='grey')
# plt.xlabel('Real label',fontsize = 18)
# plt.ylabel('Prediction',fontsize = 18)
# plt.ylabel('True label', fontdict={'family': 'Times New Roman', 'size': 20}) # 设置字体大小。
# plt.xlabel('Predicted label', fontdict={'family': 'Times New Roman', 'size': 20})
thresh = confusion_matrix.max() / 2.
iters = np.reshape([[[i,j] for j in range(10)] for i in range(10)],(confusion_matrix.size,2))
for i, j in iters:
    if confusion_matrix[i, j]>80:
        plt.text(j, i, format(confusion_matrix[i, j]),fontsize = 4,color='white',va = 'center', ha = 'center')#显示对应的数字
    else:
        plt.text(j, i, format(confusion_matrix[i, j]),fontsize = 4,va = 'center', ha = 'center')

plt.tight_layout()

# plt.title('CM')
plt.imshow(confusion_matrix, interpolation='nearest', cmap=plt.cm.Greys)  #按照像素显示出矩阵
# plt.colorbar() #旁边的颜色条我去掉了
f.savefig('F:\\WorkSpace\\CM\\figure.png',dpi=400,bbox_inches='tight',pad_inches=0.02) #保存本地去除大部分空白
plt.show()
结果图

