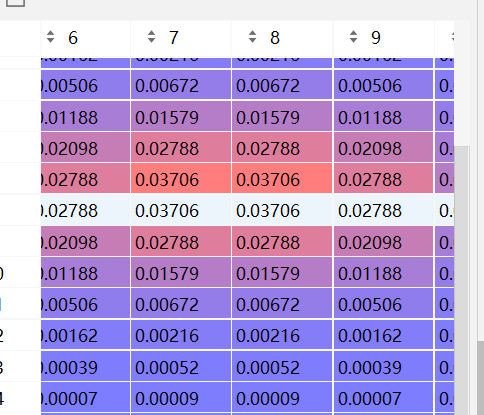
Python生成gussian图像
Python生成gussian图像
import numpy as np
import matplotlib.pyplot as plt


def dnorm(x, mu, sd):
    return 1/(np.sqrt(2 * np.pi) * sd) * np.e ** (-np.power((x - mu)/sd, 2)/2)


def gaussian_kernel(size, sigma=1, verbose=False):
    kernel_1D = np.linspace(-(size // 2), size // 2, size)
    for i in range(size):
        kernel_1D[i] = dnorm(kernel_1D[i], 0, sigma)
    kernel_2D = np.outer(kernel_1D.T, kernel_1D.T)
    kernel_2D *= 1.0 / kernel_2D.max()
    if verbose:
        plt.imshow(kernel_2D, interpolation='none',cmap='gray')
        plt.title("Image")
        plt.show()

    return kernel_2D

gaussian_kernel(15, sigma=1, verbose=True)
升级版
https://blog.csdn.net/xuguofei2006/article/details/108263228
import numpy as np
import matplotlib.pyplot as plt
from mpl_toolkits.mplot3d import Axes3D

x,y = np.mgrid[-5:5:200j,-5:5:200j]
sigma = 2
z = 1/(2 * np.pi * (sigma**2)) * np.exp(-(x**2+y**2)/(2 * sigma**2))


fig = plt.figure()
ax = Axes3D(fig)
ax.plot_surface(x, y, z, rstride=1, cstride=1, cmap='rainbow',alpha = 0.9)

plt.show()
————————————————
版权声明:本文为CSDN博主「xuguofei2006」的原创文章,遵循CC 4.0 BY-SA版权协议,转载请附上原文出处链接及本声明。
原文链接:https://blog.csdn.net/xuguofei2006/article/details/108263228
def normalization(data):
_range = np.max(data) - np.min(data)
return (data - np.min(data)) / _range
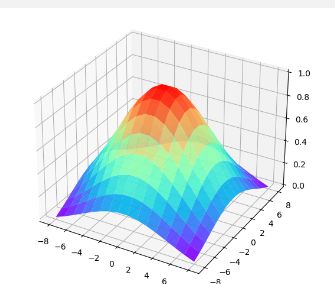
x,y = np.mgrid[-8:8:16j,-8:8:16j]
sigma = 5
z = 1/(2 * np.pi * (sigma**2)) * np.exp(-(x**2+y**2)/(2 * sigma**2))
z2 = normalization(z)fig = plt.figure()
ax = Axes3D(fig)
ax.plot_surface(x, y, z2, rstride=1, cstride=1, cmap='rainbow',alpha = 0.9)
plt.show()


