matplotlib 绘图
figure, ax基础
plt.***和ax.***的区别
我认为所有不先讲清楚plt.和ax. 两种画图方式的区别的教程都是耍流氓。一上来就告诉你,plt.figure(), plt.plot(), plt.show(),这么画就对了的,都是不负责任的表现!
- 在matplotlib中,有两种画图方式:
- plt.figure(): plt.***系列。通过http://plt.xxx来画图,其实是取了一个捷径。这是通过matplotlib提供的一个api,这个plt提供了很多基本的function可以让你很快的画出图来,但是如果你想要更细致的精调,就要使用另外一种方法。
plt.figure(1)
plt.subplot(211)
plt.plot(A,B)
plt.show()
- fig, ax = plt.subplots(): 这个就是正统的稍微复杂一点的画图方法了。指定figure和axes,然后对axes单独操作。等下就讲figure和axes都神马意思。
fig, ax = plt.subplots()
ax.plot(A,B)
名词解释 in matplotlib
-
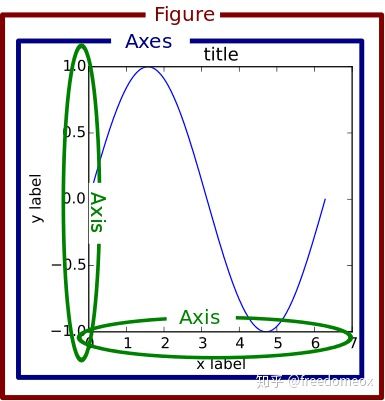
Figure fig = plt.figure(): 可以解释为画布。
画图的第一件事,就是创建一个画布figure,然后在这个画布上加各种元素。 -
Axes ax = fig.add_subplot(1,1,1): 就是坐标轴们,包括所有元素。
如果你的figure只有一张图,那么你只有一个axes。如果你的figure有subplot,那么每一个subplot就是一个axes
axes是matlibplot的宇宙中心!axes下可以修改编辑的变量非常多,基本上能包含你的所有需求。 -
Axis ax.xaxis/ax.yaxis: 对,这才是你的xy坐标轴。
每个坐标轴实际上也是由竖线和数字组成的,每一个竖线其实也是一个axis的subplot,因此ax.xaxis也存在axes这个对象。对这个axes进行编辑就会修改xaxis图像上的表现。
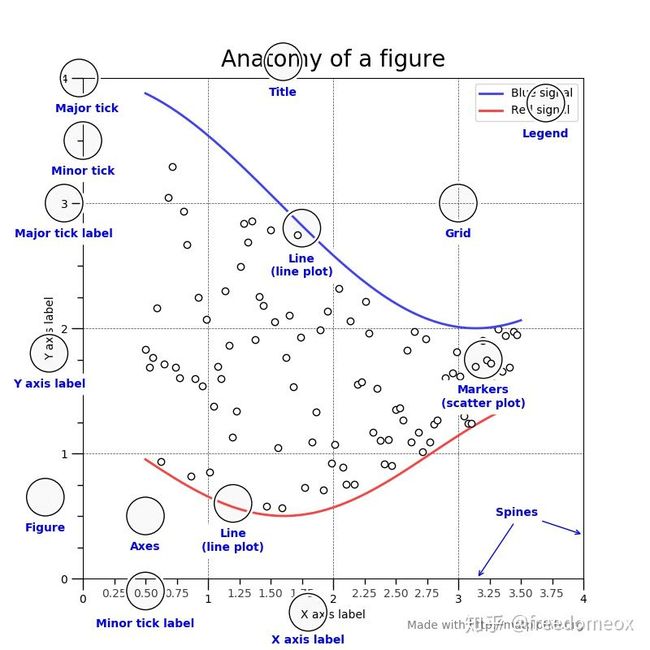
图像的各个部位名称
再从使用指南 User Guide 借个图。每个部分的名称指南,这样当你想修改一个部位的时候,起码知道关键字啊。

传统方法画个图
下面就是实战。用调取ax的方式来画个图。不要用plt!!
import matplotlib.pyplot as plt
import numpy as np
%matplotlib inline
A = np.arange(1,5)
B = A**2
C = A**3
首先,搞个画布
我喜欢用这个命令来开始画图。哪怕你没有subplot,也可以用这个subplots来创建一个画布。
这个function创建了一个大小为(14,7)的画布,把这个画布赋值给变量fig,同时在这个画布上创建了一个axes,把这个axes赋值给ax。这样,所有未来的fig.xxx都是对这个画布的操作,所有ax.xxx都是对这个axes的操作。
如果你有两个图,那么ax是一个有两个元素ax[0],ax[1] 的list。ax[0]就对应第一个subplot的ax。
fig, ax = plt.subplots(figsize=(14,7))
# fig, ax = plt.subplots(2,1,figsize(14,7))
# ax[0].***
# ax[1].***
好了画布搞好了,画数据。
注意,我们这里依然不使用plt!因为我们要在这个axes上画数据,因此就用ax.plot()来画。画完第一个再call一次,再画第二个。
ax.plot(A,B)
ax.plot(B,A)
下面开始细节的处理
数据画好了就可以各种细调坐标轴啊,tick啊之类的。
首先把标题和xy坐标轴的标题搞定。Again, 不用plt。直接在axes上进行设定。
ax.set_title('Title',fontsize=18)
ax.set_xlabel('xlabel', fontsize=18,fontfamily = 'sans-serif',fontstyle='italic')
ax.set_ylabel('ylabel', fontsize='x-large',fontstyle='oblique')
ax.legend()
然后是xy坐标轴的一些属性设定, 也是在axes level上完成的
ax.set_aspect('equal')
ax.minorticks_on()
ax.set_xlim(0,16)
ax.grid(which='minor', axis='both')
最后是坐标轴tick和细节,这个在axes.xaxis or axes.yaxis上完成。
ax.xaxis.set_tick_params(rotation=45,labelsize=18,colors='w')
start, end = ax.get_xlim()
ax.xaxis.set_ticks(np.arange(start, end,1))
ax.yaxis.tick_right()
参考
https://zhuanlan.zhihu.com/p/93423829
各种函数
在无GUI的 shell 上画图
直接画图会报错
qt.qpa.screen: QXcbConnection: Could not connect to display localhost:11.0
Could not connect to any X display.
只需要加入下面这行代码:
plt.switch_backend("agg")
然后画图之后使用
plt.savefig("result.png")
保存图片即可
https://www.cnblogs.com/wmr95/articles/7767258.html
保存图像
https://matplotlib.org/3.1.1/api/_as_gen/matplotlib.pyplot.imsave.html
# 直接保存array(图片)
# matplotlib.pyplot.imsave(fname, arr, **kwargs)
plt.imsave('./temp.png', inp)
中文字符显示
需要自己指定显示字体。
import matplotlib.pyplot as plt
from matplotlib.font_manager import *  # 如果想在图上显示中文,需导入这个包

myfont3 = FontProperties(fname=r'C:\Windows\Fonts\FZSTK.TTF', size=18)  # 标注字体
plt.annotate("这%s我们发了%d条消息!" % (str_list[time_flag], max_num),
                         xy=(max_indx,max_num), fontproperties=myfont3)
也可以这样
# 支持中文
plt.rcParams['font.sans-serif'] = ['SimHei']  # 用来正常显示中文标签
plt.rcParams['axes.unicode_minus'] = False  # 用来正常显示负号
plt.annotate
annotate用于在图形上给文字添加注解,支持带箭头的划线工具,方便我们在合适的地方添加描述信息。
参数说明:
*Axes.``annotate(s, xy, *args, *kwargs)
- **s:**注释文本的内容
- **xy:**被注释的坐标点,二维元组形如(x,y)
- **xytext:**注释文本的坐标点,也是二维元组,默认与xy相同
- **xycoords:**被注释点的坐标系属性,允许输入的值如下
| 属性值 | 含义 |
|---|---|
| ‘figure points’ | 以绘图区左下角为参考,单位是点数 |
| ‘figure pixels’ | 以绘图区左下角为参考,单位是像素数 |
| ‘figure fraction’ | 以绘图区左下角为参考,单位是百分比 |
| ‘axes points’ | 以子绘图区左下角为参考,单位是点数(一个figure可以有多个axex,默认为1个) |
| ‘axes pixels’ | 以子绘图区左下角为参考,单位是像素数 |
| ‘axes fraction’ | 以子绘图区左下角为参考,单位是百分比 |
| ‘data’ | 以被注释的坐标点xy为参考 (默认值) |
| ‘polar’ | 不使用本地数据坐标系,使用极坐标系 |
返回值:Annotation对象
https://blog.csdn.net/leaf_zizi/article/details/82886755
实例
简单画折线图
https://www.cnblogs.com/chenhuabin/p/12418411.html
设置字体大小
# -*- encoding: utf-8 -*-
import numpy as np
import matplotlib.pyplot as plt

x1 = ['BoW', '+W2V', '+GRU', '+clip', '+BERT']
x2 = ['rx101', '+re152', '+wsl', '+clip', '+ircsn', '+c3d', '+tf', '+x3d']

y1 = [[0.189, 0.202, 0.207, 0.255, 0.243], [0.190, 0.211, 0.216, 0.254, 0.255], [0.196, 0.203, 0.210, 0.266, 0.266],]
y2 = [[0.194, 0.207, 0.234, 0.245, 0.255, 0.254, 0.260, 0.229], [0.211, 0.216, 0.244, 0.257, 0.268, 0.263, 0.262, 0.265],
      [0.203, 0.21, 0.241, 0.281, 0.284, 0.285, 0.283, 0.283]]

fontsize_ = 14
# 设置刻度字体大小
plt.xticks(fontsize=fontsize_)
plt.yticks(fontsize=fontsize_)

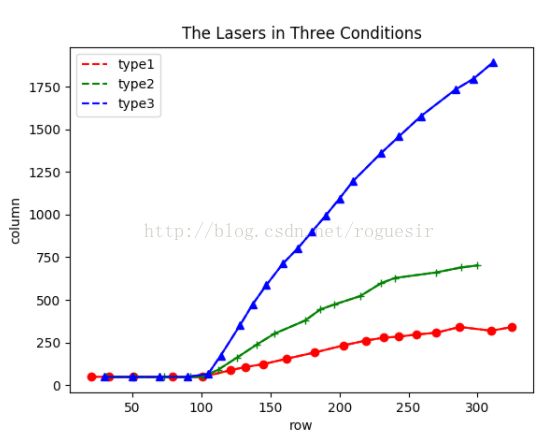
l1 = plt.plot(x1, y1[0], 'ro-', label='W2VV++')
l2 = plt.plot(x1, y1[1], 'g+-', label='SEA')
l3 = plt.plot(x1, y1[2], 'b^-', label='LAFF')
plt.plot(x1, y1[0], 'ro-', x1, y1[1], 'g+-', x1, y1[2], 'b^-')
# plt.title('The Lasers in Three Conditions')
plt.xlabel('Text features', fontsize=fontsize_)
plt.ylabel('mAP', fontsize=fontsize_)
plt.legend(fontsize=fontsize_)
plt.savefig("D:\\研究生\\组会\\AAAI\\model_adjust_txt_encoder.pdf")
plt.show()
颜色
颜色通过color参数来设置,color参数的值可以使颜色的英文全称,例如’green’、‘red’,也可以是简写,例如’g’表示’green’、‘r表示’red’,一些常见颜色全称和简写如下所示。
'b', blue'g', green'r', red'c', cyan'm', magenta'y', yellow'k', black'w', white
如果觉得这些常见的颜色不够用,设置可以用16进制字符来表示颜色。
x1 = np.linspace(0.0, 5.0, 10)
y1 = np.cos(2 * np.pi * x1) * np.exp(-x1)
fig, axes = plt.subplots(1, 2, figsize=(10, 3), tight_layout=True)

# 折线图
axes[0].set_title('图1 折 线 图')
axes[0].plot(x1, y1, color='red')  # 红色
axes[0].plot(x1, y1+0.5, color='g')  # 绿色
axes[0].plot(x1, y1+1, color='#008000')  # 也是绿色

# 散点图
axes[1].set_title('图2 散 点 图')
axes[1].scatter(x1, y1, color='red')  # 红色
axes[1].scatter(x1, y1+0.5, color='g')  # 绿色
axes[1].scatter(x1, y1+1, color='#008000')  # 也是绿色
plt.show()
标记(形状)
参数marker可以在图形中添加标记,标记参数值和对应的标记类型如下所示:
    =============    ===============================
    character        description
    =============    ===============================
    ``'.'``          点
    ``','``          像素点
    ``'o'``          圆
    ``'v'``          向下三角形
    ``'^'``          向上三角形
    ``'<'``          向左三角形
    ``'>'``          向右三角形
    ``'1'``          向下T形
    ``'2'``          向上T形
    ``'3'``          向左T形
    ``'4'``          向右T形
    ``'s'``          正方形
    ``'p'``          五边形
    ``'*'``          星型
    ``'h'``          六边形1
    ``'H'``          六边形2
    ``'+'``          十字形
    ``'x'``          x 形
    ``'D'``          大菱形
    ``'d'``          小菱形
    ``'|'``          竖线
    ``'_'``          横线
x1 = np.linspace(0.0, 5.0, 10)
y1 = np.cos(2 * np.pi * x1) * np.exp(-x1)
fig, axes = plt.subplots(1, 2, figsize=(10, 3), tight_layout=True)

axes[0].plot(x1, y1, color='black', label='.', marker='.')
axes[0].plot(x1, y1+0.5, color='green', label=',', marker=',')
axes[0].plot(x1, y1+1, color='blue',  label='o', marker='|')
axes[0].plot(x1, y1+1.5, color='red', label='v', marker='_')
axes[0].legend()

axes[1].scatter(x1, y1, color='black', label='.', marker='.')
axes[1].scatter(x1, y1+0.5, color='green', label=',', marker=',')
axes[1].scatter(x1, y1+1, color='blue',  label='o', marker='|')
axes[1].scatter(x1, y1+1.5, color='red', label='v', marker='_')
axes[1].legend()
plt.show()
1. 找到数组中频率最大的数,在直方图中标注出来
import seaborn as sns
import numpy as np
import matplot.pyplot as plt

data_list = [self.to_struct_time(t)[time_flag] for t in self.chat_time]  # 得到数据列表
max_indx = np.argmax(np.bincount(data_list))  # 出现次数最多的数据
max_num = np.bincount(data_list)[max_indx]  # 出现次数

sns.distplot(data_list, 365, kde=False, color='lightcoral')

plt.xticks(np.arange(1, 366, 30), fontsize=15)
plt.ylabel('消息条数', fontproperties=myfont2)
plt.annotate("这%s我们发了%d条消息!" % (str_list[time_flag], max_num),
xy=(max_indx,max_num), fontproperties=myfont3)
https://blog.csdn.net/ssswill/article/details/86617912
2. matplotlib绘制动图
谨以此文纪念我两天来的悲剧。
function 1.
第一种方法就是采用matplotlib中的一种交互方式,这样我们就能保证在plt.show()的时候进程不会挂起,所以达到绘制图画的时候能够连续起来,这种在你做实验的时候画着比较简单,不需要新的知识,只要用过plt画图,几乎一看就明白,下面给出例子:
if __name__ == "__main__":
    fig = plt.figure()
    plt.ion()
    plt.show()
    ims = []
    for i in range(1,10):
        im = plt.plot(np.linspace(0, i,10), np.linspace(0, np.random.randint(i),10))
        ims.append(im)
        plt.draw()
        plt.pause(0.5)
这段代码没什么实际意义,只是为了显示plt绘制动图,主要代码有plt.ion()代表着开启交互模式,所以plt.show()就不会影响后面的代码,后面就是普通的画图,画线段plt.plot(),然后plt.draw()就充当了绘制的作用,然后plt.pause()代表暂停0.5秒,这个由于比较简单,可以在网上找到大量例子,并且都是可以运行和实现的。
或者像下面一样画到一个figure里面。
import matplotlib.pyplot as plt
fig,ax=plt.subplots()
y1=[]
for i in range(50):
    y1.append(i)
    ax.cla()
    ax.bar(y1,label='test',height=y1,width=0.3)
    ax.legend()
    plt.pause(0.3)
但是上面的都只能实现显示,但是保存不了,只能使用window录频软件保存。后来发现使用animation可以进行保存,所以就开始了animation求学之路。其实现在animation也不是很懂。。。
function 2.
其实使用animation画图也不是很麻烦,网上的大多数代码都能运行,并且也能看明白是在干什么。因为我觉得在这个过程中主要是在探索保存的过程中花了时间,所以就着重讲一下如何保存,先看下面这个例子。
import matplotlib.pyplot as plt
import matplotlib.animation as animation
import numpy as np
if __name__ == "__main__":
    fig = plt.figure()
    ims = []
    for i in range(1,10):
        im = plt.plot(np.linspace(0, i,10), np.linspace(0, np.random.randint(i),10))
        ims.append(im)
    ani = animation.ArtistAnimation(fig, ims, interval=200, repeat_delay=1000)
    ani.save("test.gif",writer='pillow')
深入了解可以看看这篇博客,我按照他的方法总是给我报错,就是很奇怪,下面是错误的地方。
https://www.cnblogs.com/endlesscoding/p/10308111.html
def draw_gjf(fig, pa, va, r):
    """
    有错误
    :param fig: figure
    :param pa: position_array n*2
    :param va: vector_array n*2
    :param r: radius
    :return:
    """
    def update_points(num):
        '''
        更新数据点
        '''
        point_ani.set_data(x[num, 0], x[num, 1], 'ro')
        point_ani1.set_data(x1[num, 0], x1[num, 1], 'bo')
        return point_ani, point_ani1,
    x = pa
    x1 = pa - va*r*3
    x2 = pa + va*r*3
    point_ani, point_ani1, = plt.plot(0, 0, 'ro', 0, 0, 'ro')
    plt.grid(ls="--")
    # 开始制作动画
    ani = animation.FuncAnimation(fig, update_points, np.arange(0, len(pa)), interval=100, blit=True)

    ani.save('sin_test2.gif', writer='imagemagick', fps=10)
参考
https://blog.csdn.net/qq_28888837/article/details/85778395
https://www.cnblogs.com/endlesscoding/p/10308111.html


