【时间序列预测】—全教程
Table of Contents
- Introduction to Time Series Analysis
- Types of data
- Time Series terminology
- Time Series Analysis
- Visualize the Time Series
- Patterns in a Time Series
- Additive and Multiplicative Time Series
- Decomposition of a Time Series
- Stationary and Non-Stationary Time Series
- How to make a time series stationary
- How to test for stationarity
- Augmented Dickey Fuller test (ADF Test)
- Kwiatkowski-Phillips-Schmidt-Shin – KPSS test (trend stationary)
- Philips Perron test (PP Test)
- Difference between white noise and a stationary series
- Detrend a Time Series
- Deseasonalize a Time Series
- How to test for seasonality of a time series
- Autocorrelation and Partial Autocorrelation Functions
- Computation of Partial Autocorrelation Function
- Lag Plots
- Granger Causality Test
- Smoothening a Time Series
- References
1. 时间序列分析简介
-
时间序列数据是在不同或有规律的时间间隔内记录的一系列数据点或观察结果。一般来说,一个时间序列是以相等的时间间隔采取的数据点序列。记录数据点的频率可以是每小时、每天、每周、每月、每季度或每年。
-
时间序列预测是使用统计模型根据过去的结果来预测时间序列的未来值的过程。
-
时间序列分析包含了分析时间序列数据的统计方法。这些方法使我们能够提取有意义的统计数据、模式和数据的其他特征。时间序列在线形图的帮助下被可视化。因此,时间序列分析涉及了解时间序列数据的固有方面,以便我们能够创建有意义和准确的预测。
-
时间序列的应用被用于统计、金融或商业应用中。时间序列数据的一个非常常见的例子是纳斯达克或道琼斯等股票指数的每日收盘值。时间序列的其他常见应用是销售和需求预测,天气预测,计量经济学,信号处理,模式识别和地震预测。
2.时间序列的组成部分
- trend趋势 - 趋势显示了时间序列数据在很长一段时间内的总体方向。趋势可以是增加的(向上),减少的(向下),或水平的(静止的)。
- seasonality季节性 - 季节性部分显示了在时间、方向和幅度方面重复的趋势。一些例子包括由于炎热的天气条件,夏天的用水量增加。
- cyclical component周期性成分 - 这些是在特定时期内没有固定重复的趋势。周期指的是一个时间序列的上升和下降、繁荣和萧条的时期,主要在商业周期中观察。这些周期不表现出季节性的变化,但一般发生在3到12年的时间段内,这取决于时间序列的性质。
- Irregular Variation不规则变化 - 这些是时间序列数据中的波动,当趋势和周期性变化被去除后,这些波动就变得很明显。这些变化是不可预测的,不稳定的,可能是也可能不是随机的。
- ETS Decomposition - ETS分解是用来分离时间序列的不同组成部分。ETS这个词代表误差、趋势和季节性。
- 在这本笔记本中,我对视频游戏的销售情况进行了时间序列分析。
3. 时间序列术语
-
在时间序列中,有各种术语和概念是我们应该知道的。这些术语和概念如下:- 1
- Dependence-依赖性–它指的是同一变量的两个观测值在之前的时间段内的关联。
- Stationarity平稳性–它显示了系列的平均值在时间段内保持不变。如果过去的影响累积起来,数值向无穷大增加,那么就不符合固定性。
- Differencing差分性–差分是用来使序列保持静止并控制自动相关的。在时间序列分析中,有些情况下我们不需要进行差分,过度差分的序列会产生错误的估计。
- Specification - 它可能涉及使用时间序列模型(如ARIMA模型)来测试因变量的线性或非线性关系。
- Exponential Smoothing指数平滑法 - 时间序列分析中的指数平滑法是根据过去和当前的价值来预测下一个时期的价值。它涉及到数据的平均化,从而使每个个案或观察的非系统性成分相互抵消。指数平滑法被用来预测短期预测。
- Curve fitting曲线拟合 - 时间序列分析中的曲线拟合回归是在数据处于非线性关系时使用。
- ARIMA - ARIMA是指自回归综合移动平均。
4. Time Series Analysis
4.1 Basic set up
import numpy as np # linear algebra
import pandas as pd # data processing, CSV file I/O (e.g. pd.read_csv)


import matplotlib as mpl
import matplotlib.pyplot as plt   # data visualization
import seaborn as sns             # statistical data visualization


import os
for dirname, _, filenames in os.walk('data'):
    for filename in filenames:
        print(os.path.join(dirname, filename))

# You can write up to 5GB to the current directory (/kaggle/working/) that gets preserved as output when you create a version using "Save & Run All"
# You can also write temporary files to /kaggle/temp/, but they won't be saved outside of the current session
data/AirPassengers.csv
4.2 Import data
path = 'data/AirPassengers.csv'

df = pd.read_csv(path)

df.head()
| Month | #Passengers | |
|---|---|---|
| 0 | 1949-01 | 112 |
| 1 | 1949-02 | 118 |
| 2 | 1949-03 | 132 |
| 3 | 1949-04 | 129 |
| 4 | 1949-05 | 121 |
We should rename the column names.
df.columns = ['Date','Number of Passengers']
df.head()
| Date | Number of Passengers | |
|---|---|---|
| 0 | 1949-01 | 112 |
| 1 | 1949-02 | 118 |
| 2 | 1949-03 | 132 |
| 3 | 1949-04 | 129 |
| 4 | 1949-05 | 121 |
5. Visualize the Time Series
def plot_df(df, x, y, title="", xlabel='Date', ylabel='Number of Passengers', dpi=100):
    plt.figure(figsize=(15,4), dpi=dpi)
    plt.plot(x, y, color='tab:red')
    plt.gca().set(title=title, xlabel=xlabel, ylabel=ylabel)
    plt.show()


plot_df(df, x=df['Date'], y=df['Number of Passengers'], title='Number of US Airline passengers from 1949 to 1960')
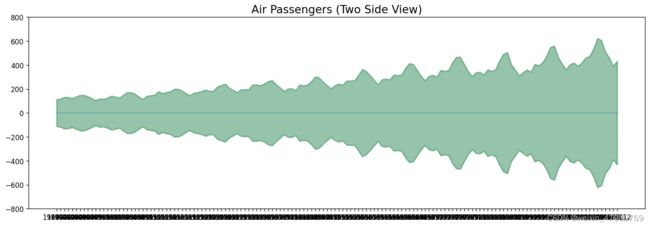
- 由于所有的数值都是正数,我们可以在Y轴的两边显示,以强调增长。
x = df['Date'].values
y1 = df['Number of Passengers'].values

# Plot
fig, ax = plt.subplots(1, 1, figsize=(16,5), dpi= 120)
plt.fill_between(x, y1=y1, y2=-y1, alpha=0.5, linewidth=2, color='seagreen')
plt.ylim(-800, 800)
plt.title('Air Passengers (Two Side View)', fontsize=16)
plt.hlines(y=0, xmin=np.min(df['Date']), xmax=np.max(df['Date']), linewidth=.5)
plt.show()
- 可以看出,它是一个月度时间序列,每年都遵循某种重复模式。因此,我们可以在同一张图中把每一年作为一个单独的线来绘制。这让我们可以并排比较各年的模式。
6. 时间序列中的模式
-
任何时间序列的可视化都可能由以下部分组成。基础水平+趋势+季节性+误差。
- trend趋势
- 当在时间序列中观察到一个增加或减少的斜率时,就可以观察到一个趋势。
- seasonality季节性
- 当由于季节性因素,在定期间隔之间观察到明显的重复模式时,就会观察到季节性。这可能是由于一年中的哪个月,哪个月的哪一天,工作日或甚至一天中的哪个时间。
- trend趋势
-
然而,并非所有时间序列都必须有趋势和/或季节性。一个时间序列可能没有一个明显的趋势,但有一个季节性,反之亦然。
def plot_df(df, x, y, title="", xlabel='Date', ylabel='Number of Passengers', dpi=100):
    plt.figure(figsize=(15,4), dpi=dpi)
    plt.plot(x, y, color='blue')
    plt.gca().set(title=title, xlabel=xlabel, ylabel=ylabel)
    plt.show()


plot_df(df, x=df['Date'], y=df['Number of Passengers'], title='Trend and Seasonality')
-
循环行为
- 另一个需要考虑的重要事情是周期性行为。它发生在系列的上升和下降模式不发生在固定的基于日历的时间间隔内。我们不应该把 "周期性 "效应和 "季节性 "效应混淆起来。
-
如果这些模式不是基于固定日历的频率,那么它就是周期性的。因为,与季节性不同,周期性效应通常受到商业和其他社会经济因素的影响。
7. Additive and Multiplicative Time Series
-
我们可能有不同的趋势和季节性的组合。根据趋势和季节性的性质,一个时间序列可以被建模为加法或乘法时间序列。系列中的每个观测值可以表示为各组成部分的总和或乘积。
-
Additive time series:
- Value = Base Level + Trend + Seasonality + Error
-
Multiplicative Time Series:
- Value = Base Level x Trend x Seasonality x Error
8. Decomposition of a Time Series
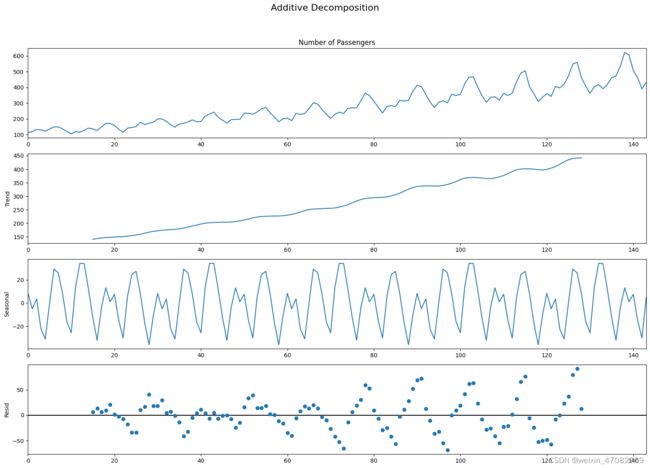
时间序列的分解可以通过将该序列视为基数水平、趋势、季节性指数和残差项的加法或乘法组合来进行。
statsmodels中的 seasonal_decompose 方便地实现了这一点
from statsmodels.tsa.seasonal import seasonal_decompose
from dateutil.parser import parse


# Multiplicative Decomposition
multiplicative_decomposition = seasonal_decompose(df['Number of Passengers'], model='multiplicative', period=30)

# Additive Decomposition
additive_decomposition = seasonal_decompose(df['Number of Passengers'], model='additive', period=30)

# Plot
plt.rcParams.update({'figure.figsize': (16,12)})
multiplicative_decomposition.plot().suptitle('Multiplicative Decomposition', fontsize=16)
plt.tight_layout(rect=[0, 0.03, 1, 0.95])

additive_decomposition.plot().suptitle('Additive Decomposition', fontsize=16)
plt.tight_layout(rect=[0, 0.03, 1, 0.95])

plt.show()
- 如果我们仔细观察加法分解的残差,它有一些残留的模式。
而乘法分解,看起来相当随机,这是好事。因此,在理想情况下,对于这个特定的系列,乘法分解应该是首选。
9. Stationary and Non-Stationary Time Series
- 平稳性性是时间序列的一个属性。一个平稳的系列是一个系列的值不是时间的函数。因此,这些值是独立于时间的。
- 因此,该系列的统计属性,如平均数、方差和自相关,随着时间的推移是不变的。系列的自相关只不过是系列与它以前的值的相关性。
- 一个平稳的时间序列也是独立于季节性影响的。
现在,我们将绘制一些平稳和非平稳时间序列的例子,以示清楚。
- 我们可以通过应用适当的转换将任何非静止的时间序列转换为静止的。大多数统计预测方法被设计为在静止的时间序列上工作。预测过程中的第一步通常是做一些转换,将非平稳序列转换为平稳。
10. How to make a time series stationary?
- 我们可以应用某种转换来使时间序列静止。这些转换可能包括。
- Differencing the Series (once or more)
- Take the log of the series
- Take the nth root of the series
- Combination of the above
使数列平稳的最常用和最方便的方法是对数列至少进行一次差分,直到它变得近似平稳。
10.1 Introduction to Differencing
-
如果 Y t Y_t Yt是时间 t t t的值,那么 Y Y Y的第一个差值 Y = Y t − Y t − 1 Y=Yt-Y_{t-1} Y=Yt−Yt−1。更简单地说,序列的差分只是用当前值减去下一个值而已。
-
如果第一次差分不能使一个序列平稳,我们可以进行第二次差分,以此类推。
- 例如,考虑以下系列。[1, 5, 2, 12, 20]
- 第一次差分后得到 [5-1, 2-5, 12-2, 20-12] = [4, -3, 10, 8]
- 二次差分得出。[-3-4, -10-3, 8-10] = [-7, -13, -2]
10.2 Reasons to convert a non-stationary series into stationary one before forecasting
我们希望将非平稳序列转换成平稳序列的原因有很多。以下是这些原因。
+ 预测一个平稳序列相对容易,而且预测结果更可靠。
+ 一个重要的原因是,自回归预测模型本质上是线性回归模型,利用序列本身的滞后期作为预测因子。
- 我们知道,如果预测因子(X变量)不相互关联,线性回归效果最好。因此,序列的平稳化解决了这个问题,因为它消除了任何持续的自相关,从而使预测模型中的预测因子(序列的滞后期)几乎是独立的。
11. How to test for stationarity?
-
一个系列的平稳性可以通过观察系列的图表来检查。
-
另一种方法是将该系列分成两个或更多的连续部分,并计算汇总统计数据,如平均值、方差和自相关。如果统计数字有很大差异,那么这个系列就不可能是静止的。
-
我们可以用几种定量的方法来确定一个给定的系列是否是平稳的。这可以通过称为单位根检验的统计检验来完成。
-
这种测试可以检查一个时间序列是否是非稳态的,是否拥有单位根。
单位根检验有多种实现方式,如:
-
Augmented Dickey Fuller test (ADF Test)
-
Kwiatkowski-Phillips-Schmidt-Shin – KPSS test (trend stationary)
-
Philips Perron test (PP Test)
11.1 Augmented Dickey Fuller test (ADF Test)
扩增迪克-富勒检验或(ADF检验)是最常用的检测静止性的检验。在这里,我们假设无效假设是时间序列拥有单位根,是非平稳的。然后,我们收集证据来支持或拒绝无效假设。因此,如果我们发现ADF检验的p值小于显著性水平(0.05),我们就拒绝无效假设。
请随时查看以下链接,以了解更多关于ADF检验的信息:
https://en.wikipedia.org/wiki/Augmented_Dickey%E2%80%93Fuller_test
https://www.machinelearningplus.com/time-series/augmented-dickey-fuller-test/
https://machinelearningmastery.com/time-series-data-stationary-python/
http://www.insightsbot.com/augmented-dickey-fuller-test-in-python/
https://nwfsc-timeseries.github.io/atsa-labs/sec-boxjenkins-aug-dickey-fuller.html
https://www.statisticshowto.com/adf-augmented-dickey-fuller-test/
11.2 Kwiatkowski-Phillips-Schmidt-Shin – KPSS test (trend stationary)
另一方面,KPSS检验是用来检验趋势的静止性。空白假设和P值的解释与ADH检验正好相反。
https://en.wikipedia.org/wiki/KPSS_test
https://www.machinelearningplus.com/time-series/kpss-test-for-stationarity/
https://www.statisticshowto.com/kpss-test/
https://nwfsc-timeseries.github.io/atsa-labs/sec-boxjenkins-kpss.html
11.3 Philips Perron test (PP Test)
Philips Perron或PP检验是一种单位根检验。在时间序列分析中,它被用来检验一个时间序列是1阶积分的无效假设。它是建立在上面讨论的ADF检验之上的。
关于PP检验的更多信息,请访问以下链接:
https://en.wikipedia.org/wiki/Phillips%E2%80%93Perron_test
https://www.mathworks.com/help/econ/pptest.html
https://people.bath.ac.uk/hssjrh/Phillips%20Perron.pdf
https://www.stata.com/manuals13/tspperron.pdf
12. Difference between white noise and a stationary series
与平稳序列一样,白噪声也不是时间的函数。因此,它的平均值和方差不随时间变化。但不同的是,白噪声是完全随机的,平均数为0,在白噪声中没有模式。
在数学上,一个平均数为0的完全随机的数字序列就是白噪声。
rand_numbers = np.random.randn(1000)
pd.Series(rand_numbers).plot(title='Random White Noise', color='b')
13. Detrend a Time Series
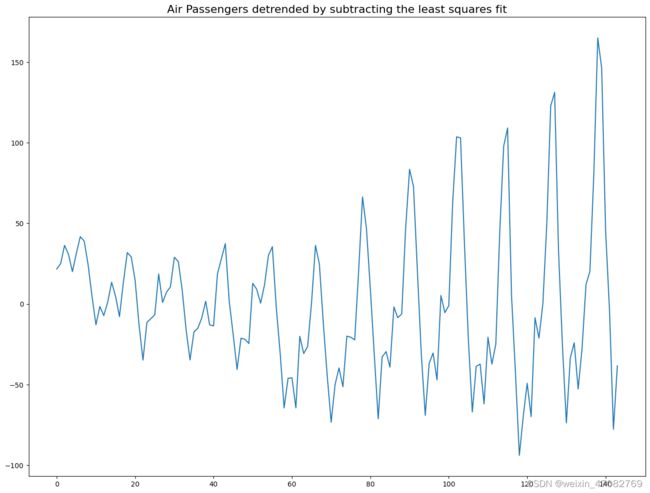
- 解除时间序列的趋势意味着从时间序列中去除趋势成分。有多种方法可以做到这一点,如下所列。
-
1.从时间序列中减去最佳拟合线。最佳拟合线可以从以时间步骤为预测因素的线性回归模型中获得。对于更复杂的趋势,我们可能希望在模型中使用二次项(x^2)。
-
2.我们减去从时间序列分解中得到的趋势成分。
-
3.减去平均值。
-
4.应用像Baxter-King滤波器(statsmodels.tsa.filters.bkfilter)或Hodrick-Prescott滤波器(statsmodels.tsa.filters.hpfilter)的滤波器来去除移动平均趋势线或周期成分。
-
现在,我们将实现前两种方法来解读时间序列。
# Using scipy: Subtract the line of best fit
from scipy import signal
detrended = signal.detrend(df['Number of Passengers'].values)
plt.plot(detrended)
plt.title('Air Passengers detrended by subtracting the least squares fit', fontsize=16)
Text(0.5, 1.0, 'Air Passengers detrended by subtracting the least squares fit')
# Using statmodels: Subtracting the Trend Component
from statsmodels.tsa.seasonal import seasonal_decompose
result_mul = seasonal_decompose(df['Number of Passengers'], model='multiplicative', period=30)
detrended = df['Number of Passengers'].values - result_mul.trend
plt.plot(detrended)
plt.title('Air Passengers detrended by subtracting the trend component', fontsize=16)
Text(0.5, 1.0, 'Air Passengers detrended by subtracting the trend component')
[外链图片转存失败,源站可能有防盗链机制,建议将图片保存下来直接上传(img-A1b9ldwF-1669094635815)(output_35_1.png)]
14. Deseasonalize a Time Series
有多种方法可以对时间序列进行去季候性处理。这些方法列举如下:
- 1.以移动平均线的长度作为季节性窗口。这将在这个过程中使序列变得平滑。
- 2.对序列进行季节性差分(用当前值减去前一季的值)。
- 3.用该系列除以从STL分解得到的季节性指数。
如果除以季节性指数效果不好,我们将对系列进行对数,然后进行去季节性处理。以后我们将通过取指数来恢复到原来的规模。
# Subtracting the Trend Component


# Time Series Decomposition
result_mul = seasonal_decompose(df['Number of Passengers'], model='multiplicative', period=30)


# Deseasonalize
deseasonalized = df['Number of Passengers'].values / result_mul.seasonal


# Plot
plt.plot(deseasonalized)
plt.title('Air Passengers Deseasonalized', fontsize=16)
plt.plot()
[]
15. How to test for seasonality of a time series?
-
检验一个时间序列的季节性的常用方法是绘制该序列,并检查固定时间间隔内的可重复模式。因此,季节性的类型是由时钟或日历决定的。
- Hour of day
- Day of month
- Weekly
- Monthly
- Yearly
-
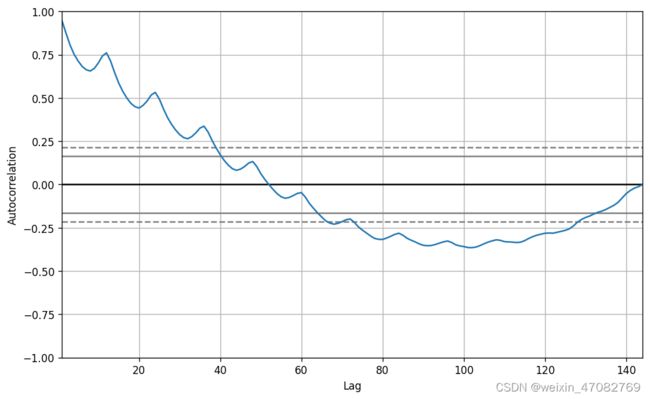
然而,如果我们想对季节性进行更明确的检查,可以使用自相关函数(ACF)图。有一个强烈的季节性模式,ACF图通常揭示了在季节性窗口的倍数上有明确的重复峰值。
# Test for seasonality
from pandas.plotting import autocorrelation_plot

# Draw Plot
plt.rcParams.update({'figure.figsize':(10,6), 'figure.dpi':120})
autocorrelation_plot(df['Number of Passengers'].tolist())
16. Autocorrelation and Partial Autocorrelation Functions 
- Autocorrelation自相关是指一个系列与它自己的滞后期的相关关系。如果一个系列是显著自相关的,这意味着,该系列的先前值(滞后)可能有助于预测当前值。
- Partial Autocorrelation部分自相关也传达了类似的信息,但它传达的是一个系列与其滞后期的纯相关,不包括中间滞后期的相关贡献。
from statsmodels.tsa.stattools import acf, pacf
from statsmodels.graphics.tsaplots import plot_acf, plot_pacf

# Draw Plot
fig, axes = plt.subplots(1,2,figsize=(16,3), dpi= 100)
plot_acf(df['Number of Passengers'].tolist(), lags=50, ax=axes[0])
plot_pacf(df['Number of Passengers'].tolist(), lags=50, ax=axes[1])
/Library/Frameworks/Python.framework/Versions/3.9/lib/python3.9/site-packages/statsmodels/graphics/tsaplots.py:348: FutureWarning: The default method 'yw' can produce PACF values outside of the [-1,1] interval. After 0.13, the default will change tounadjusted Yule-Walker ('ywm'). You can use this method now by setting method='ywm'.
  warnings.warn(
17. Computation of Partial Autocorrelation Function
- 一个序列的滞后期(k)的部分自相关函数是Y的自回归方程中该滞后期的系数。Y的自回归方程只不过是以其自身的滞后期为预测因素对Y进行的线性回归。
- 例如,如果 Y t Y_t Yt是当前序列, Y t − 1 Y_{t-1} Yt−1是 Y Y Y的滞后1,那么滞后3 ( Y t − 3 ) (Y_{t-3}) (Yt−3)的部分自相关是 Y t − 3 Y_{t-3} Yt−3在以下方程中的系数3 Y t = α 0 + α 1 Y t − 1 + α 2 Y t − 2 + α 3 Y t − 3 Y_t = α_0+α_1Y_{t-1}+α_2Y_{t-2}+α_3Y_{t-3} Yt=α0+α1Yt−1+α2Yt−2+α3Yt−3
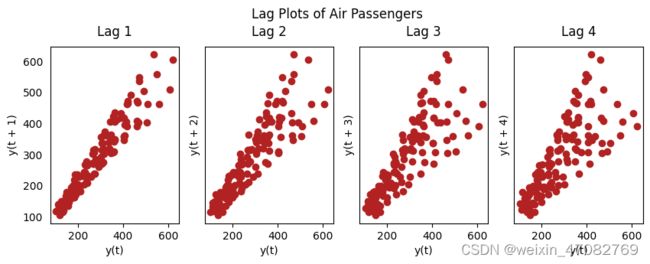
18. Lag Plots
滞后图是一个时间序列与自身滞后的散点图。它通常被用来检查自相关。如果系列中存在任何模式,该系列是自相关的。如果没有这种模式,该系列可能是随机白噪声。
from pandas.plotting import lag_plot
plt.rcParams.update({'ytick.left' : False, 'axes.titlepad':10})

# Plot
fig, axes = plt.subplots(1, 4, figsize=(10,3), sharex=True, sharey=True, dpi=100)
for i, ax in enumerate(axes.flatten()[:4]):
    lag_plot(df['Number of Passengers'], lag=i+1, ax=ax, c='firebrick')
    ax.set_title('Lag ' + str(i+1))

fig.suptitle('Lag Plots of Air Passengers', y=1.05)
plt.show()
19. Granger Causality Test
- 格兰杰因果关系测试是用来确定一个时间序列是否有助于预测另一个时间序列。它是基于这样的想法:如果X导致Y,那么基于Y的前值和X的前值对Y的预测应该优于仅基于Y的前值的预测。
- 因此,格兰杰因果关系测试不应该被用来测试Y的滞后期是否导致Y。它是在statsmodel包中实现的。
- 它接受一个有两列的二维数组作为主要参数。数值在第一列,预测因子(X)在第二列。无效假设是第二列中的序列不会导致第一列中的序列的格兰杰。如果P值小于显著性水平(0.05),那么我们拒绝无效假设,并得出结论,所述的X的滞后期确实是有用的。第二个参数maxlag说的是在测试中应该包括多少个Y的滞后期。
from statsmodels.tsa.stattools import grangercausalitytests
data = pd.read_csv('data/AirPassengers.csv')
data.columns = ['date','value']
data.head()
data['date'] = pd.to_datetime(data['date'])
data['month'] = data.date.dt.month
grangercausalitytests(data[['value', 'month']], maxlag=2)
Granger Causality
number of lags (no zero) 1
ssr based F test:         F=7.4080  , p=0.0073  , df_denom=140, df_num=1
ssr based chi2 test:   chi2=7.5667  , p=0.0059  , df=1
likelihood ratio test: chi2=7.3733  , p=0.0066  , df=1
parameter F test:         F=7.4080  , p=0.0073  , df_denom=140, df_num=1

Granger Causality
number of lags (no zero) 2
ssr based F test:         F=4.9761  , p=0.0082  , df_denom=137, df_num=2
ssr based chi2 test:   chi2=10.3154 , p=0.0058  , df=2
likelihood ratio test: chi2=9.9579  , p=0.0069  , df=2
parameter F test:         F=4.9761  , p=0.0082  , df_denom=137, df_num=2


{1: ({'ssr_ftest': (7.407967762077246, 0.007318844731632684, 140.0, 1),
   'ssr_chi2test': (7.566709928407473, 0.005945621865036116, 1),
   'lrtest': (7.373310381387228, 0.00661989587473731, 1),
   'params_ftest': (7.4079677620772815, 0.007318844731632552, 140.0, 1.0)},
  [,
   ,
   array([[0., 1., 0.]])]),
 2: ({'ssr_ftest': (4.976083922906437, 0.008199795902675753, 137.0, 2),
   'ssr_chi2test': (10.315385650404584, 0.005754962083917427, 2),
   'lrtest': (9.957923125859452, 0.006881204546490603, 2),
   'params_ftest': (4.976083922906381, 0.008199795902676155, 137.0, 2.0)},
  [,
   ,
   array([[0., 0., 1., 0., 0.],
          [0., 0., 0., 1., 0.]])])}
20. Smoothening a Time Series
时间序列的平滑化在以下情况下可能是有用的。
- 减少信号中的噪声影响,得到一个公平的、经过噪声过滤的系列的近似值。
- 平滑化后的系列可以作为解释原始系列本身的特征。
- 更好地观察基本趋势。
我们可以用以下方法使时间序列平滑化。
- 取一个移动平均线
- 做一个 LOESS 平滑化(局部回归)。
- 做一个LOWESS平滑处理(局部加权回归)。
Moving Average
- 移动平均数是定义宽度的滚动窗口的平均值。我们必须明智地选择窗口的宽度,因为大的窗口尺寸会使序列过度平滑。例如,一个等于季节性持续时间的窗口尺寸(例如:12个月的系列),将有效地消除季节性效应。
Localized Regression
- LOESS是 "Localized Regression "的缩写,它在每个点的局部区域内拟合多个回归结果。它是在statsmodels软件包中实现的,你可以用frac参数来控制平滑的程度,该参数指定了附近的数据点的百分比,应该被视为适合回归模型。
`

