吴恩达机器学习ex2 python实现
这个项目包含了吴恩达机器学习ex2的python实现,主要知识点为逻辑回归、正则化。
1.逻辑回归
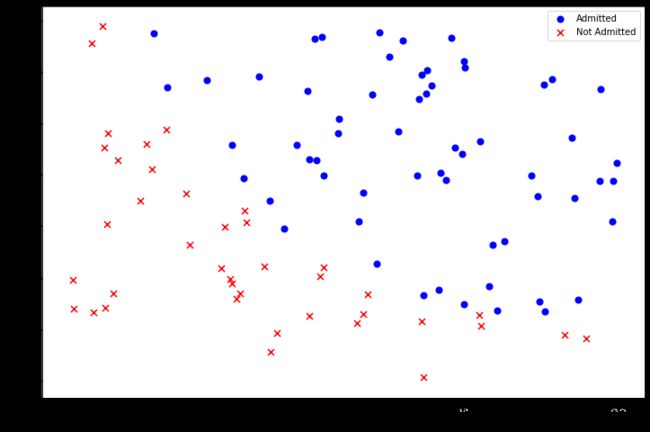
构建一个逻辑回归模型来预测,某个学生是否被大学录取。对于每一个训练样本,你有他们两次测试的评分和最后是被录取的结果。
1.1查看数据分布
import numpy as np
import pandas as pd
import matplotlib.pyplot as plt

path=r'C:\Users\xxx\Desktop\机器学习\machine-learning-ex2\machine-learning-ex2\ex2\ex2data1.txt'
data=pd.read_csv(path,header=None,names=['Exam 1','Exam 2','Admitted'])
data.head()
| Exam 1 | Exam 2 | Admitted | |
|---|---|---|---|
| 0 | 34.623660 | 78.024693 | 0 |
| 1 | 30.286711 | 43.894998 | 0 |
| 2 | 35.847409 | 72.902198 | 0 |
| 3 | 60.182599 | 86.308552 | 1 |
| 4 | 79.032736 | 75.344376 | 1 |
positive = data[data['Admitted'].isin([1])]
negative = data[data['Admitted'].isin([0])]

fig, ax = plt.subplots(figsize=(12,8))
ax.scatter(positive['Exam 1'], positive['Exam 2'], s=50, c='b', marker='o', label='Admitted')
ax.scatter(negative['Exam 1'], negative['Exam 2'], s=50, c='r', marker='x', label='Not Admitted')
ax.legend()
ax.set_xlabel('Exam 1 Score')
ax.set_ylabel('Exam 2 Score')
plt.show()
1.2定义各种函数
def sigmoid(z):
    return 1 / (1 + np.exp(-z))
定义代价函数
假设函数
def cost(theta, X, y):
    theta = np.matrix(theta)
    X = np.matrix(X)
    y = np.matrix(y)
    first = np.multiply(-y, np.log(sigmoid(X * theta.T)))
    second = np.multiply((1 - y), np.log(1 - sigmoid(X * theta.T)))
    return np.sum(first - second) / (len(X))
def gradient(theta, X, y):
    theta = np.matrix(theta)
    X = np.matrix(X)
    y = np.matrix(y)

    parameters = int(theta.ravel().shape[1])
    grad = np.zeros(parameters)

    error = sigmoid(X * theta.T) - y

    for i in range(parameters):
        term = np.multiply(error, X[:,i])
        grad[i] = np.sum(term) / len(X)

    return grad
1.3数据预处理
data.insert(0, 'Ones', 1)

# 初始化X,y,θ
cols = data.shape[1]
X = data.iloc[:,:-1]
y = data.iloc[:,cols-1:cols]
theta = np.zeros(3)

# 转换X,y的类型
X = np.array(X.values)
y = np.array(y.values)
X.shape, theta.shape, y.shape
((100, 3), (3,), (100, 1))
1.4利用模型进行预测
cost(theta, X, y)
0.6931471805599453
调用库函数实现梯度下降
import scipy.optimize as opt
result = opt.fmin_tnc(func=cost, x0=theta, fprime=gradient, args=(X, y))
result
(array([-25.16131872, 0.20623159, 0.20147149]), 36, 0)
cost(result[0],X,y)
0.20349770158947425
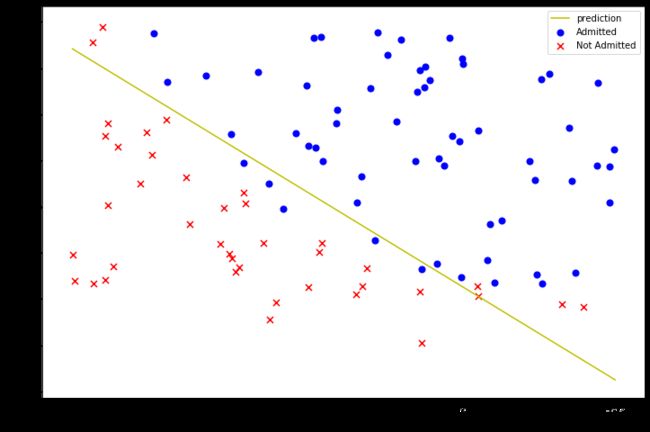
1.5画出决策曲线
plotting_x1 =np.linspace(30,100,100)
plotting_h1 =(-result[0][0]-result[0][1]*plotting_x1)/result[0][2]
# θ0+θ1x+θ2y=0
fig,ax= plt.subplots(figsize=(12,8))
ax.plot(plotting_x1,plotting_h1,'y',label='prediction')
ax.scatter(positive['Exam 1'], positive['Exam 2'], s=50, c='b', marker='o', label='Admitted')
ax.scatter(negative['Exam 1'], negative['Exam 2'], s=50, c='r', marker='x', label='Not Admitted')
ax.legend()
ax.set_xlabel('Exam 1 Score')
ax.set_ylabel('Exam 2 Score')
plt.show()
1.5计算acc
def hfunc1(theta,X):
    return sigmoid(np.sum(X*theta))
hfunc1(result[0],[1,45,85])
0.776290625526598
def predict(theta,X):
    probability =sigmoid(X*theta.T)
    return [1 if x>=0.5 else 0 for x in probability]
theta_min=np.matrix(result[0])
predictions=predict(theta_min,X)
correct=[1 if((a==1 and b==1)or (a==0 and b==0))
         else 0 for(a,b)in zip(predictions,y)]
# print(sum(map(int ,correct)))
# print(len(correct))
acc=(sum(map(int ,correct))/len(correct)*100)
print('acc={0}%'.format(acc))
acc=89.0%
2.正则化逻辑回归
本项目在逻辑回归的基础上加入了正则化项
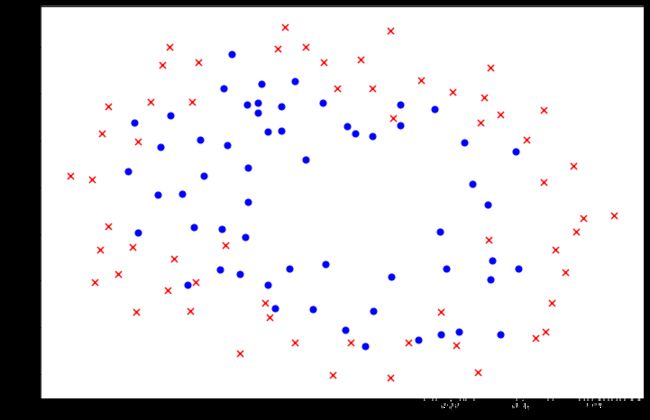
2.1查看数据分布
path=r'C:\Users\xxx\Desktop\机器学习\machine-learning-ex2\machine-learning-ex2\ex2\ex2data2.txt'
data_init=pd.read_csv(path,header=None,names=['Test 1', 'Test 2', 'Accepted'])
data_init.head()
| Test 1 | Test 2 | Accepted | |
|---|---|---|---|
| 0 | 0.051267 | 0.69956 | 1 |
| 1 | -0.092742 | 0.68494 | 1 |
| 2 | -0.213710 | 0.69225 | 1 |
| 3 | -0.375000 | 0.50219 | 1 |
| 4 | -0.513250 | 0.46564 | 1 |
postive2=data_init[data_init['Accepted'].isin([1])]
negative2=data_init[data_init['Accepted'].isin([0])]

fig,ax=plt.subplots(figsize=(12,8))
ax.scatter(postive2['Test 1'],postive2['Test 2'],s=50,c='b',marker='o',label='Accepted')
ax.scatter(negative2['Test 1'],negative2['Test 2'],s=50,c='r',marker='x',label=' Not Accepted')
2.2添加更多的特征
degree=6
data2=data_init
x1=data2['Test 1']
x2=data2['Test 2']
data2.insert(3,'Ones',1)
for i in range(1,degree+1):
    for j in range(0,i+1):
        data2['F'+str(i-j)+str(j)]=np.power(x1,i-j)*np.power(x2,j)

data2.drop('Test 1',axis=1,inplace=True)
data2.drop('Test 2',axis=1,inplace=True)
data2.head()
| Accepted | Ones | F10 | F01 | F20 | F11 | F02 | F30 | F21 | F12 | ... | F23 | F14 | F05 | F60 | F51 | F42 | F33 | F24 | F15 | F06 | |
|---|---|---|---|---|---|---|---|---|---|---|---|---|---|---|---|---|---|---|---|---|---|
| 0 | 1 | 1 | 0.051267 | 0.69956 | 0.002628 | 0.035864 | 0.489384 | 0.000135 | 0.001839 | 0.025089 | ... | 0.000900 | 0.012278 | 0.167542 | 1.815630e-08 | 2.477505e-07 | 0.000003 | 0.000046 | 0.000629 | 0.008589 | 0.117206 |
| 1 | 1 | 1 | -0.092742 | 0.68494 | 0.008601 | -0.063523 | 0.469143 | -0.000798 | 0.005891 | -0.043509 | ... | 0.002764 | -0.020412 | 0.150752 | 6.362953e-07 | -4.699318e-06 | 0.000035 | -0.000256 | 0.001893 | -0.013981 | 0.103256 |
| 2 | 1 | 1 | -0.213710 | 0.69225 | 0.045672 | -0.147941 | 0.479210 | -0.009761 | 0.031616 | -0.102412 | ... | 0.015151 | -0.049077 | 0.158970 | 9.526844e-05 | -3.085938e-04 | 0.001000 | -0.003238 | 0.010488 | -0.033973 | 0.110047 |
| 3 | 1 | 1 | -0.375000 | 0.50219 | 0.140625 | -0.188321 | 0.252195 | -0.052734 | 0.070620 | -0.094573 | ... | 0.017810 | -0.023851 | 0.031940 | 2.780914e-03 | -3.724126e-03 | 0.004987 | -0.006679 | 0.008944 | -0.011978 | 0.016040 |
| 4 | 1 | 1 | -0.513250 | 0.46564 | 0.263426 | -0.238990 | 0.216821 | -0.135203 | 0.122661 | -0.111283 | ... | 0.026596 | -0.024128 | 0.021890 | 1.827990e-02 | -1.658422e-02 | 0.015046 | -0.013650 | 0.012384 | -0.011235 | 0.010193 |
5 rows × 29 columns
2.2定义代价函数和梯度
def costReg(theta,X,y,learningRate):
    theta=np.matrix(theta)
    X=np.matrix(X)
    y=np.matrix(y)
    first=np.multiply(-y,np.log(sigmoid(X*theta.T)))
    second=np.multiply((1-y),np.log(1-sigmoid(X*theta.T)))
    reg=(learningRate/(2*len(X)))*np.sum(np.power(theta[:,1:],2))
    return np.sum(first-second)/len(X)+reg
def gradientReg(theta, X, y, learningRate):
    theta = np.matrix(theta)
    X = np.matrix(X)
    y = np.matrix(y)

    parameters = int(theta.ravel().shape[1])
    grad = np.zeros(parameters)

    error = sigmoid(X * theta.T) - y

    for i in range(parameters):
        term = np.multiply(error, X[:,i])

        if (i == 0):
            grad[i] = np.sum(term) / len(X)
        else:
            grad[i] = (np.sum(term) / len(X)) + ((learningRate / len(X)) * theta[:,i])
    return grad
2.3处理数据格式
cols=data2.shape[1]
X2 = data2.iloc[:,1:cols]
y2 = data2.iloc[:,0:1]
theta2 = np.zeros(cols-1)

X2=np.array(X2.values)
y2=np.array(y2.values)

learningRate=1
2.4 利用库进行预测
costReg(theta2,X2,y2,learningRate)
0.6931471805599454
result2=opt.fmin_tnc(func=costReg,x0=theta2,fprime=gradientReg, args=(X2, y2, learningRate))
result2
(array([ 1.27271027,  0.62529965,  1.18111686, -2.01987399, -0.91743189,
        -1.43166929,  0.12393228, -0.36553118, -0.35725403, -0.17516291,
        -1.45817009, -0.05098418, -0.61558554, -0.27469165, -1.19271298,
        -0.24217841, -0.20603298, -0.04466178, -0.27778951, -0.29539513,
        -0.45645981, -1.04319155,  0.02779373, -0.2924487 ,  0.0155576 ,
        -0.32742405, -0.1438915 , -0.92467487]), 32, 1)
theta_min = np.matrix(result2[0])
predictions = predict(theta_min, X2)
correct = [1 if ((a == b)) else 0 for (a, b) in zip(predictions, y2)]
accuracy = (sum(map(int, correct)) /len(correct))*100
print(sum(map(int, correct)))
print ('accuracy = {0}%'.format(accuracy))
98
accuracy = 83.05084745762711%
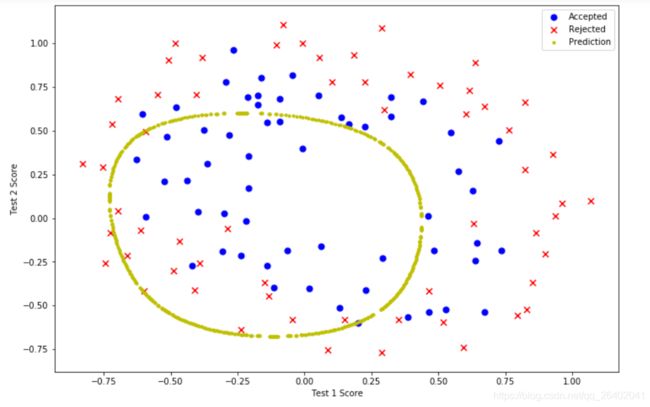
2.4 决策曲线
def hfunc2(theta, x1, x2):
    temp = theta[0][0]
    place = 0
    for i in range(1, degree+1):
        for j in range(0, i+1):
            temp+= np.power(x1, i-j) * np.power(x2, j) * theta[0][place+1]
            place+=1
    return temp
def find_decision_boundary(theta):
    t1=np.linspace(-1,1.5,1000)
    t2=np.linspace(-1,1.5,1000)
    cordinates=[(x,y)for x in t1 for y in t2]
    x_cord,y_cord=zip(*cordinates)
    h_val=pd.DataFrame({'x1':x_cord,'x2':y_cord})
    h_val['hval']=hfunc2(theta, h_val['x1'], h_val['x2'])
#     print(h_val)
    decison=h_val[np.abs(sigmoid(h_val['hval'])-0.5)<0.01]
    return decison.x1,decison.x2
fig, ax = plt.subplots(figsize=(12,8))
ax.scatter(postive2['Test 1'], postive2['Test 2'], s=50, c='b', marker='o', label='Accepted')
ax.scatter(negative2['Test 1'], negative2['Test 2'], s=50, c='r', marker='x', label='Rejected')
ax.set_xlabel('Test 1 Score')
ax.set_ylabel('Test 2 Score')

x, y = find_decision_boundary(result2)
plt.scatter(x, y, c='y', s=10, label='Prediction')
ax.legend()
plt.show()
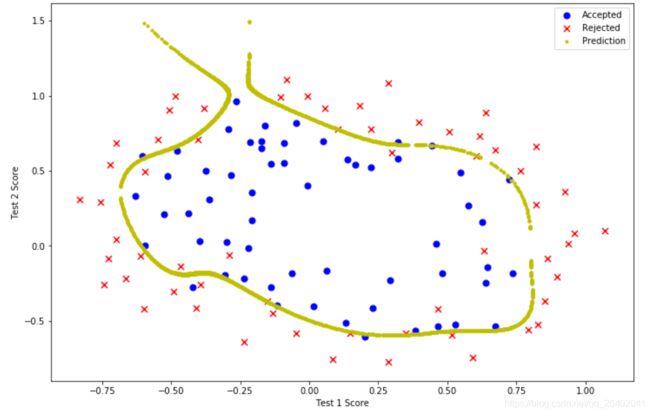
λ=0,过拟合
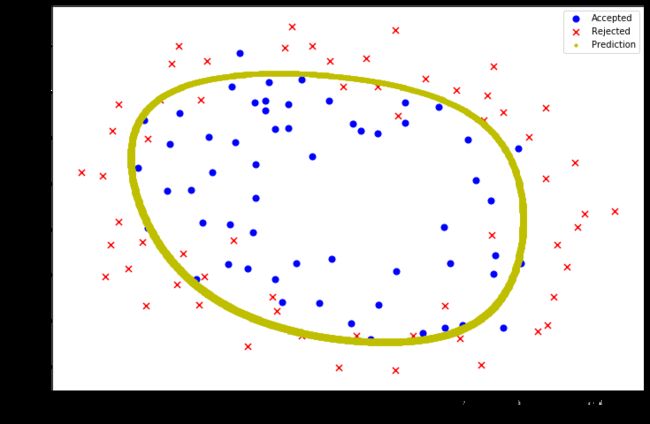
λ=1,拟合得比较好
总结
- theta0不需要正则化
- zip() 函数用于将可迭代的对象作为参数,将对象中对应的元素打包成一个个元组,然后返回由这些元组组成的列表。zip() 和 * 操作符一起操作可以用来 unzip 一个列表
