python自定义函数的参数拟合
example:xdata是输入,ydata是输出
import numpy as np
import matplotlib.pyplot as plt
from scipy.optimize import curve_fit
def func(x, a, b, c):
return a * np.exp(-b * x) + c
# Define the data to be fit with some noise:
xdata = np.linspace(0, 4, 50)
y = func(xdata, 2.5, 1.3, 0.5)
np.random.seed(1729)
y_noise = 0.2 * np.random.normal(size=xdata.size)
ydata = y + y_noise
plt.plot(xdata, ydata, 'b-', label='data')
# Fit for the parameters a, b, c of the function func:
popt, pcov = curve_fit(func, xdata, ydata)
print(popt)
plt.plot(xdata, func(xdata, *popt), 'r-',
label='fit: a=%5.3f, b=%5.3f, c=%5.3f' % tuple(popt))
# Constrain the optimization to the region of 0 <= a <= 3, 0 <= b <= 1 and 0 <= c <= 0.5:
popt, pcov = curve_fit(func, xdata, ydata, bounds=(0, [3., 1., 0.5]))
print(popt)
plt.plot(xdata, func(xdata, *popt), 'g--',
label='fit: a=%5.3f, b=%5.3f, c=%5.3f' % tuple(popt))
plt.xlabel('x')
plt.ylabel('y')
plt.legend()
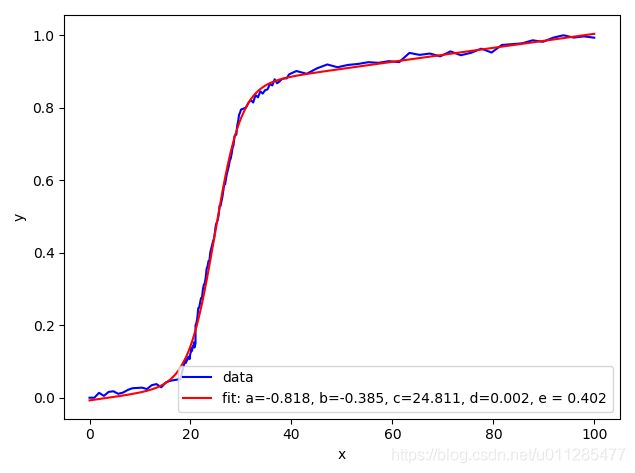
plt.show()全参考图像质量评价中,PSNR的输出取值范围是0~100 dB,想要把其输出范围映射到0~1区间的话,参考[2]的方法,用下面的式子来拟合,总共有5个参数。
 下面的代码中,xdata表示PSNR的数值,ydata表示对应的0~1范围数值。
import numpy as np
import matplotlib.pyplot as plt
from scipy.optimize import curve_fit


def func(x, a, b, c, d, e):
  logist = 0.5 - 1/(1+np.exp(b * (x-c)))
  return a*logist + d*x + e


# Define the data to be fit with some noise:
xdata = np.hstack([np.linspace(0, 18, 20), np.linspace(19, 21, 20), np.linspace(21, 30, 50),np.linspace(31, 40, 20),np.linspace(41, 100, 30)])
ydata = np.hstack([np.linspace(0, 0.05, 20),np.linspace(0.1, 0.15, 20), np.linspace(0.2, 0.8, 50), np.linspace(0.81, 0.9, 20), np.linspace(0.9, 1.0, 30)])

np.random.seed(1729)
y_noise = 0.005 * np.random.normal(size=xdata.size)
ydata = ydata + y_noise


for i in range(ydata.size):
  if ydata[i] < 0:
    ydata[i] = 0
  if ydata[i] > 100:
    ydata[i] = 100

plt.plot(xdata, ydata, 'b-', label='data')

# Fit for the parameters a, b, c of the function func:
popt, pcov = curve_fit(func, xdata, ydata)
print(popt)
plt.plot(xdata, func(xdata, *popt), 'r-',
         label='fit: a=%5.3f, b=%5.3f, c=%5.3f, d=%5.3f, e = %5.3f' % tuple(popt))


plt.xlabel('x')
plt.ylabel('y')
plt.legend()
plt.show()
[1] python 自定义函数表达式 拟合求系数
[2] H. R. Sheikh, M. F. Sabir, and A. C. Bovik, “A statistical evaluation of recent full reference image quality assessment algorithms,”IEEE Trans. Image Process., vol. 15, no. 11, pp. 3440–3451, Nov. 2006.