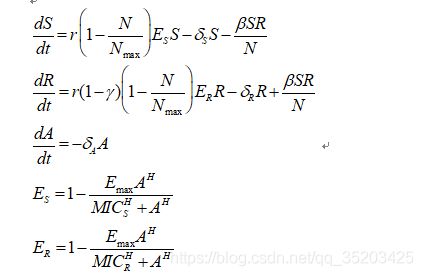
微分方程:

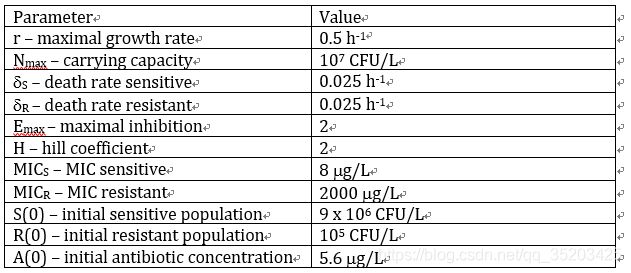
初始值:

问题:
求解其他三个参数:

代码实现:
import numpy as np
from numpy import zeros, linspace, arange
from scipy.integrate import odeint
import matplotlib.pyplot as plt
from mpl_toolkits.mplot3d import Axes3D
def read_data(path):
with open(path, 'r') as f:
data = f.read()
time, num = [], []
data = data.strip().split('\n')
for items in data:
t, n = items.split()
time.append(float(t))
num.append(float(n))
return time, num
def funcS(S, R, A, r, Nmax, ds, beta, Emax, MICs, H):
Es = 1 - Emax * np.power(A, H) / (np.power(MICs, H) + np.power(A, H))
return r * (1 - (R + S) / Nmax) * Es * S - ds * S - beta * S * R / (S + R)
def funcR(S, R, A, r, Nmax, dr, beta, Emax, MICr, H, gamma):
Er = 1 - Emax * np.power(A, H) / (np.power(MICr, H) + np.power(A, H))
return r * (1 - gamma) * (1 - (R + S) / Nmax) * Er * R - dr * R - beta * S * R / (S + R)
def funcA(A, da):
return -da * A
def func_all(y, t, parameters):
S, R, A = y
r, Nmax, ds, dr, Emax, H, MICs, MICr, beta, gamma, da = parameters
func1 = funcS(S, R, A, r, Nmax, ds, beta, Emax, MICs, H)
func2 = funcR(S, R, A, r, Nmax, dr, beta, Emax, MICr, H, gamma)
func3 = funcA(A, da)
return np.array([func1, func2, func3])
path = './amrdata.txt'
time, num = read_data(path)
print(time)
print(num)
r = 0.5
Nmax = 1.0e7
ds = 0.025
dr = 0.025
Emax = 2
H = 2
MICs = 8
MICr = 2000
beta = 1.0e-11
gamma = 0.05
da = 0.001
S0 = 9 * 1.0e6
R0 = 1.0e5
A0 = 5.6
y0 = [S0, R0, A0]
bmin, bmax = 1.0e-6, 1.0e-4
gmin, gmax = 0.01, 0.2
amin, amax = 0.001, 0.03
beta_range = arange(bmin, bmax, (bmax - bmin) / 30)
print(beta_range)
gamma_range = arange(gmin, gmax, (gmax - gmin) / 30)
print(gamma_range)
da_range = arange(amin, amax, (amax - amin) / 30)
print(da_range)
MIN_RMSE = 1000
best_beta = beta
best_gamma = gamma
best_da = da
for b in beta_range:
for g in gamma_range:
for a in da_range:
beta = b
gamma = g
da = a
parameters = [r, Nmax, ds, dr, Emax, H, MICs, MICr, beta, gamma, da]
sol = odeint(func_all, y0, time, (parameters,))
S, R, A = sol[:, 0], sol[:, 1], sol[:, 2]
N = 100 * R / (S + R)
res = 0
for i in range(len(num)):
res += (num[i] - N[i]) ** 2
RMSE = np.sqrt(res) / len(num)
if RMSE < MIN_RMSE:
MIN_RMSE = RMSE
best_beta = beta
best_gamma = gamma
best_da = da
print("---------MIN_RMSE-------\n RMSE= %f" % MIN_RMSE)
print("beta= %f, gamma= %f, da= %f" % (beta, gamma, da))
parameters = [r, Nmax, ds, dr, Emax, H, MICs, MICr, best_beta, best_gamma, best_da]
sol = odeint(func_all, y0, time, (parameters,))
S, R, A = sol[:, 0], sol[:, 1], sol[:, 2]
N = 100 * R / (S + R)
plt.plot(time, num)
plt.plot(time, N)
plt.xlabel("time/H")
plt.ylabel("the number of resistant strains")
plt.show()
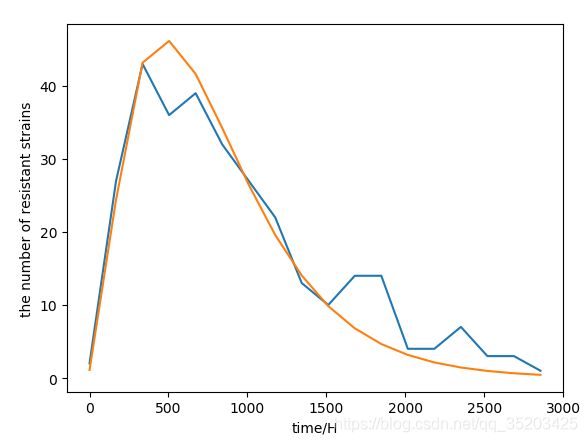
拟合情况:
可以看到两条曲线很接近,效果很好。


